Blackfeet vs Lebanese Child Poverty Among Girls Under 16
COMPARE
Blackfeet
Lebanese
Child Poverty Among Girls Under 16
Child Poverty Among Girls Under 16 Comparison
Blackfeet
Lebanese
20.5%
CHILD POVERTY AMONG GIRLS UNDER 16
0.0/ 100
METRIC RATING
287th/ 347
METRIC RANK
16.6%
CHILD POVERTY AMONG GIRLS UNDER 16
45.4/ 100
METRIC RATING
175th/ 347
METRIC RANK
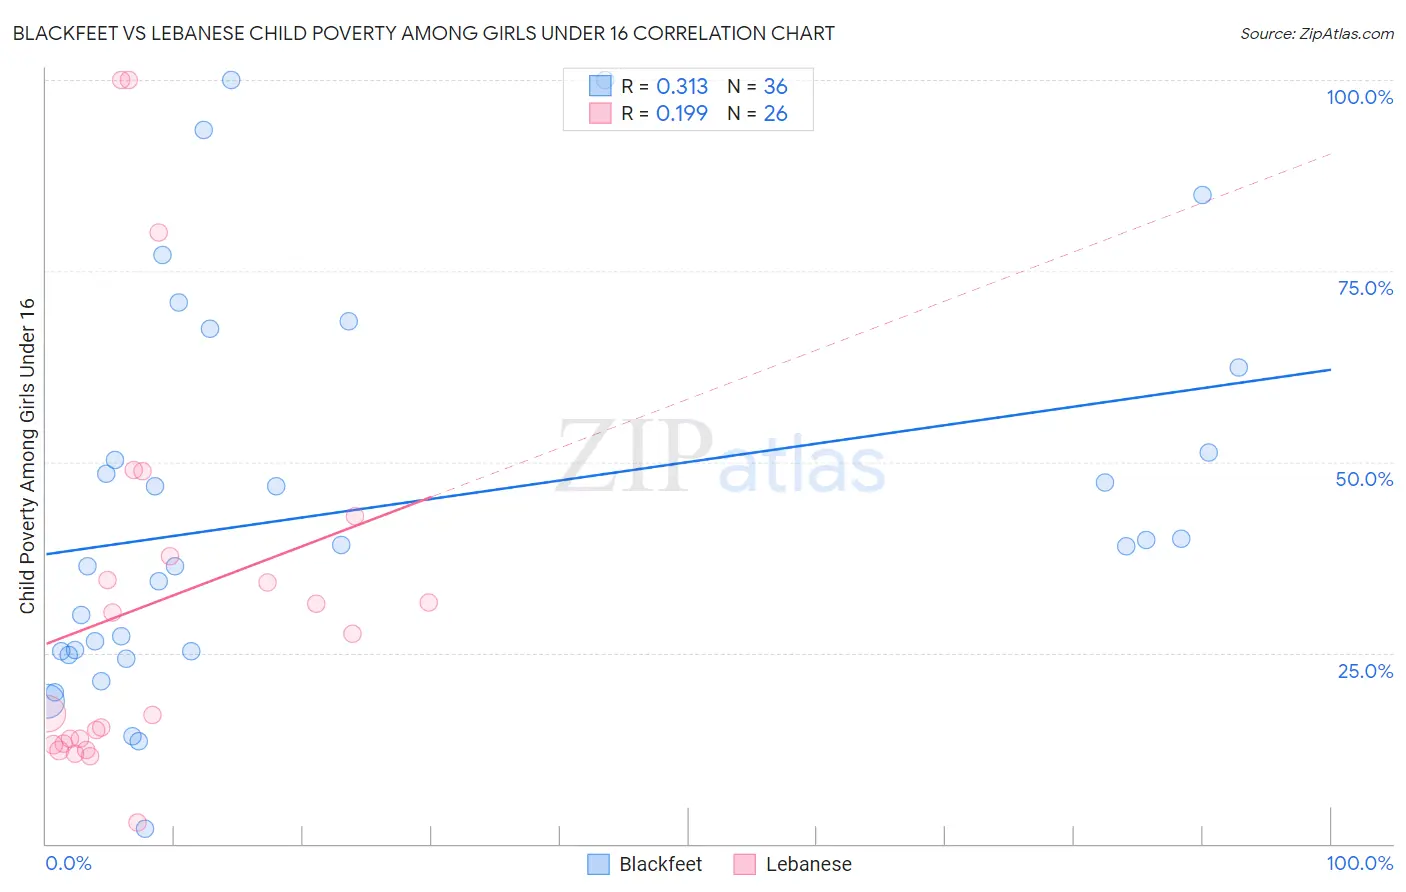
Blackfeet vs Lebanese Child Poverty Among Girls Under 16 Correlation Chart
The statistical analysis conducted on geographies consisting of 306,739,151 people shows a mild positive correlation between the proportion of Blackfeet and poverty level among girls under the age of 16 in the United States with a correlation coefficient (R) of 0.313 and weighted average of 20.5%. Similarly, the statistical analysis conducted on geographies consisting of 392,919,578 people shows a poor positive correlation between the proportion of Lebanese and poverty level among girls under the age of 16 in the United States with a correlation coefficient (R) of 0.199 and weighted average of 16.6%, a difference of 23.6%.
Child Poverty Among Girls Under 16 Correlation Summary
| Measurement | Blackfeet | Lebanese |
| Minimum | 2.0% | 2.8% |
| Maximum | 100.0% | 100.0% |
| Range | 98.0% | 97.2% |
| Mean | 43.8% | 31.4% |
| Median | 39.0% | 22.3% |
| Interquartile 25% (IQ1) | 25.2% | 13.2% |
| Interquartile 75% (IQ3) | 56.8% | 37.7% |
| Interquartile Range (IQR) | 31.6% | 24.5% |
| Standard Deviation (Sample) | 25.1% | 26.2% |
| Standard Deviation (Population) | 24.8% | 25.7% |
Similar Demographics by Child Poverty Among Girls Under 16
Demographics Similar to Blackfeet by Child Poverty Among Girls Under 16
In terms of child poverty among girls under 16, the demographic groups most similar to Blackfeet are Iroquois (20.4%, a difference of 0.14%), Haitian (20.5%, a difference of 0.20%), Immigrants from Cabo Verde (20.3%, a difference of 0.53%), Immigrants from Belize (20.6%, a difference of 0.66%), and Yaqui (20.3%, a difference of 0.67%).
| Demographics | Rating | Rank | Child Poverty Among Girls Under 16 |
| Immigrants | Liberia | 0.0 /100 | #280 | Tragic 20.2% |
| Central Americans | 0.0 /100 | #281 | Tragic 20.2% |
| West Indians | 0.0 /100 | #282 | Tragic 20.3% |
| Senegalese | 0.0 /100 | #283 | Tragic 20.3% |
| Yaqui | 0.0 /100 | #284 | Tragic 20.3% |
| Immigrants | Cabo Verde | 0.0 /100 | #285 | Tragic 20.3% |
| Iroquois | 0.0 /100 | #286 | Tragic 20.4% |
| Blackfeet | 0.0 /100 | #287 | Tragic 20.5% |
| Haitians | 0.0 /100 | #288 | Tragic 20.5% |
| Immigrants | Belize | 0.0 /100 | #289 | Tragic 20.6% |
| Immigrants | Haiti | 0.0 /100 | #290 | Tragic 20.6% |
| Chippewa | 0.0 /100 | #291 | Tragic 20.6% |
| Immigrants | Latin America | 0.0 /100 | #292 | Tragic 20.6% |
| Immigrants | Grenada | 0.0 /100 | #293 | Tragic 20.7% |
| Immigrants | Senegal | 0.0 /100 | #294 | Tragic 20.7% |
Demographics Similar to Lebanese by Child Poverty Among Girls Under 16
In terms of child poverty among girls under 16, the demographic groups most similar to Lebanese are Hungarian (16.6%, a difference of 0.030%), Immigrants from Western Asia (16.6%, a difference of 0.15%), White/Caucasian (16.6%, a difference of 0.20%), Hawaiian (16.6%, a difference of 0.23%), and Immigrants from Syria (16.6%, a difference of 0.24%).
| Demographics | Rating | Rank | Child Poverty Among Girls Under 16 |
| Yugoslavians | 64.4 /100 | #168 | Good 16.2% |
| Costa Ricans | 64.2 /100 | #169 | Good 16.2% |
| Immigrants | Venezuela | 64.2 /100 | #170 | Good 16.2% |
| Immigrants | Saudi Arabia | 64.0 /100 | #171 | Good 16.2% |
| Afghans | 62.3 /100 | #172 | Good 16.2% |
| Immigrants | South America | 55.1 /100 | #173 | Average 16.4% |
| Ethiopians | 50.0 /100 | #174 | Average 16.5% |
| Lebanese | 45.4 /100 | #175 | Average 16.6% |
| Hungarians | 45.1 /100 | #176 | Average 16.6% |
| Immigrants | Western Asia | 44.1 /100 | #177 | Average 16.6% |
| Whites/Caucasians | 43.6 /100 | #178 | Average 16.6% |
| Hawaiians | 43.4 /100 | #179 | Average 16.6% |
| Immigrants | Syria | 43.3 /100 | #180 | Average 16.6% |
| Immigrants | Iraq | 43.2 /100 | #181 | Average 16.6% |
| Immigrants | Ethiopia | 43.1 /100 | #182 | Average 16.6% |