Maltese vs Latvian Child Poverty Among Boys Under 16
COMPARE
Maltese
Latvian
Child Poverty Among Boys Under 16
Child Poverty Among Boys Under 16 Comparison
Maltese
Latvians
13.2%
CHILD POVERTY AMONG BOYS UNDER 16
99.9/ 100
METRIC RATING
16th/ 347
METRIC RANK
13.4%
CHILD POVERTY AMONG BOYS UNDER 16
99.9/ 100
METRIC RATING
23rd/ 347
METRIC RANK
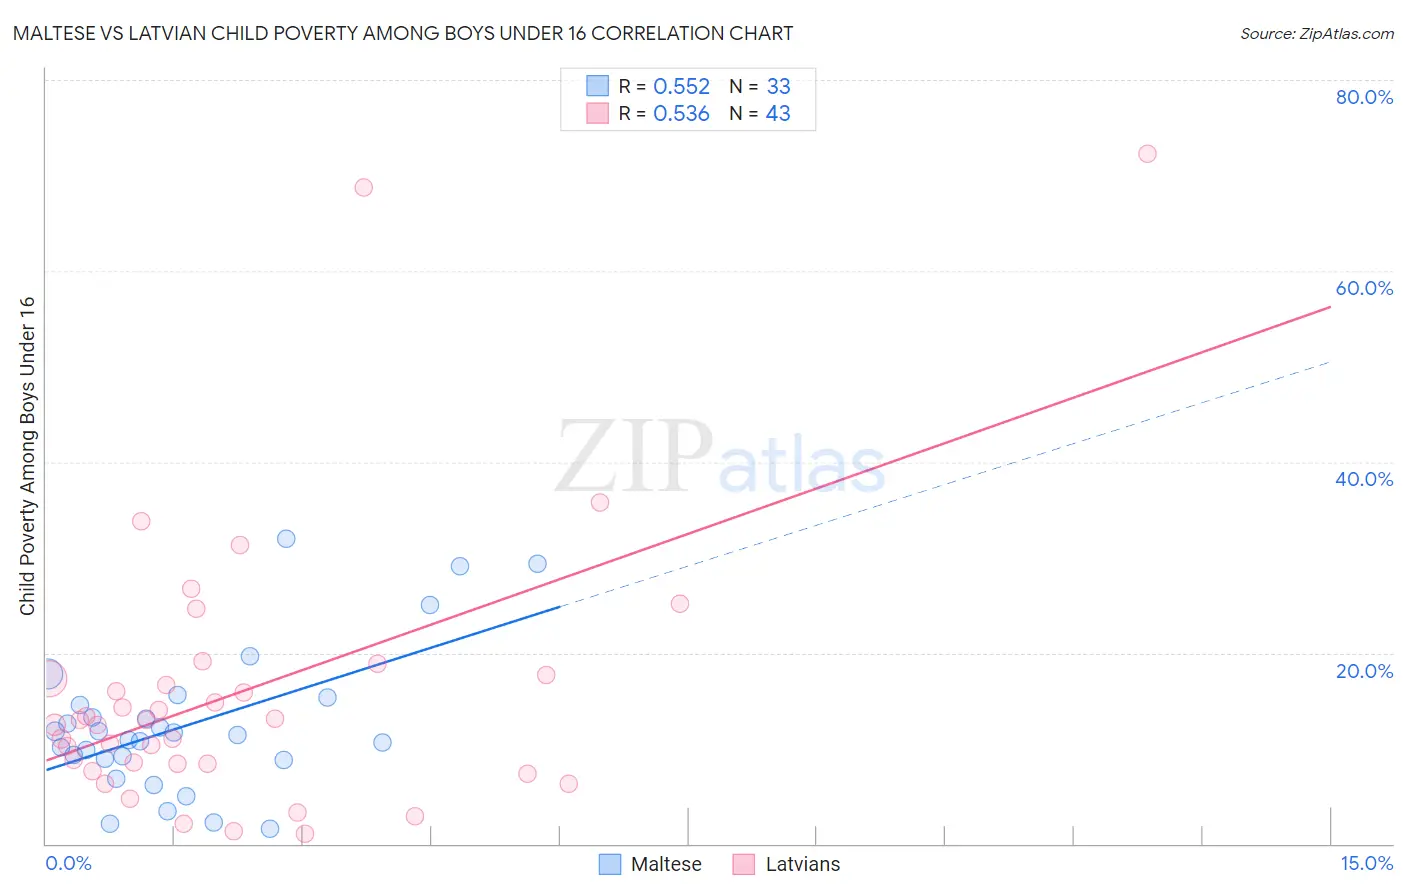
Maltese vs Latvian Child Poverty Among Boys Under 16 Correlation Chart
The statistical analysis conducted on geographies consisting of 125,189,723 people shows a substantial positive correlation between the proportion of Maltese and poverty level among boys under the age of 16 in the United States with a correlation coefficient (R) of 0.552 and weighted average of 13.2%. Similarly, the statistical analysis conducted on geographies consisting of 217,672,016 people shows a substantial positive correlation between the proportion of Latvians and poverty level among boys under the age of 16 in the United States with a correlation coefficient (R) of 0.536 and weighted average of 13.4%, a difference of 1.5%.
Child Poverty Among Boys Under 16 Correlation Summary
| Measurement | Maltese | Latvian |
| Minimum | 1.6% | 1.1% |
| Maximum | 31.9% | 72.3% |
| Range | 30.3% | 71.3% |
| Mean | 12.5% | 16.0% |
| Median | 11.4% | 12.9% |
| Interquartile 25% (IQ1) | 8.8% | 8.4% |
| Interquartile 75% (IQ3) | 15.0% | 17.6% |
| Interquartile Range (IQR) | 6.2% | 9.2% |
| Standard Deviation (Sample) | 7.5% | 14.7% |
| Standard Deviation (Population) | 7.4% | 14.5% |
Demographics Similar to Maltese and Latvians by Child Poverty Among Boys Under 16
In terms of child poverty among boys under 16, the demographic groups most similar to Maltese are Norwegian (13.2%, a difference of 0.090%), Immigrants from Japan (13.1%, a difference of 0.32%), Immigrants from Ireland (13.1%, a difference of 0.42%), Bulgarian (13.3%, a difference of 0.62%), and Bolivian (13.3%, a difference of 0.68%). Similarly, the demographic groups most similar to Latvians are Tongan (13.4%, a difference of 0.080%), Immigrants from Eastern Asia (13.3%, a difference of 0.16%), Indian (Asian) (13.3%, a difference of 0.76%), Bolivian (13.3%, a difference of 0.80%), and Immigrants from Lithuania (13.5%, a difference of 0.84%).
| Demographics | Rating | Rank | Child Poverty Among Boys Under 16 |
| Immigrants | Iran | 100.0 /100 | #9 | Exceptional 12.5% |
| Bhutanese | 100.0 /100 | #10 | Exceptional 12.6% |
| Immigrants | South Central Asia | 100.0 /100 | #11 | Exceptional 12.7% |
| Burmese | 99.9 /100 | #12 | Exceptional 13.0% |
| Immigrants | Korea | 99.9 /100 | #13 | Exceptional 13.0% |
| Immigrants | Ireland | 99.9 /100 | #14 | Exceptional 13.1% |
| Immigrants | Japan | 99.9 /100 | #15 | Exceptional 13.1% |
| Maltese | 99.9 /100 | #16 | Exceptional 13.2% |
| Norwegians | 99.9 /100 | #17 | Exceptional 13.2% |
| Bulgarians | 99.9 /100 | #18 | Exceptional 13.3% |
| Bolivians | 99.9 /100 | #19 | Exceptional 13.3% |
| Indians (Asian) | 99.9 /100 | #20 | Exceptional 13.3% |
| Immigrants | Eastern Asia | 99.9 /100 | #21 | Exceptional 13.3% |
| Tongans | 99.9 /100 | #22 | Exceptional 13.4% |
| Latvians | 99.9 /100 | #23 | Exceptional 13.4% |
| Immigrants | Lithuania | 99.8 /100 | #24 | Exceptional 13.5% |
| Okinawans | 99.8 /100 | #25 | Exceptional 13.5% |
| Immigrants | Bolivia | 99.8 /100 | #26 | Exceptional 13.5% |
| Asians | 99.8 /100 | #27 | Exceptional 13.5% |
| Eastern Europeans | 99.8 /100 | #28 | Exceptional 13.5% |
| Cypriots | 99.8 /100 | #29 | Exceptional 13.6% |