Native/Alaskan vs Immigrants from St. Vincent and the Grenadines Child Poverty Under the Age of 5
COMPARE
Native/Alaskan
Immigrants from St. Vincent and the Grenadines
Child Poverty Under the Age of 5
Child Poverty Under the Age of 5 Comparison
Natives/Alaskans
Immigrants from St. Vincent and the Grenadines
25.6%
CHILD POVERTY UNDER THE AGE OF 5
0.0/ 100
METRIC RATING
333rd/ 347
METRIC RANK
20.0%
CHILD POVERTY UNDER THE AGE OF 5
0.2/ 100
METRIC RATING
258th/ 347
METRIC RANK
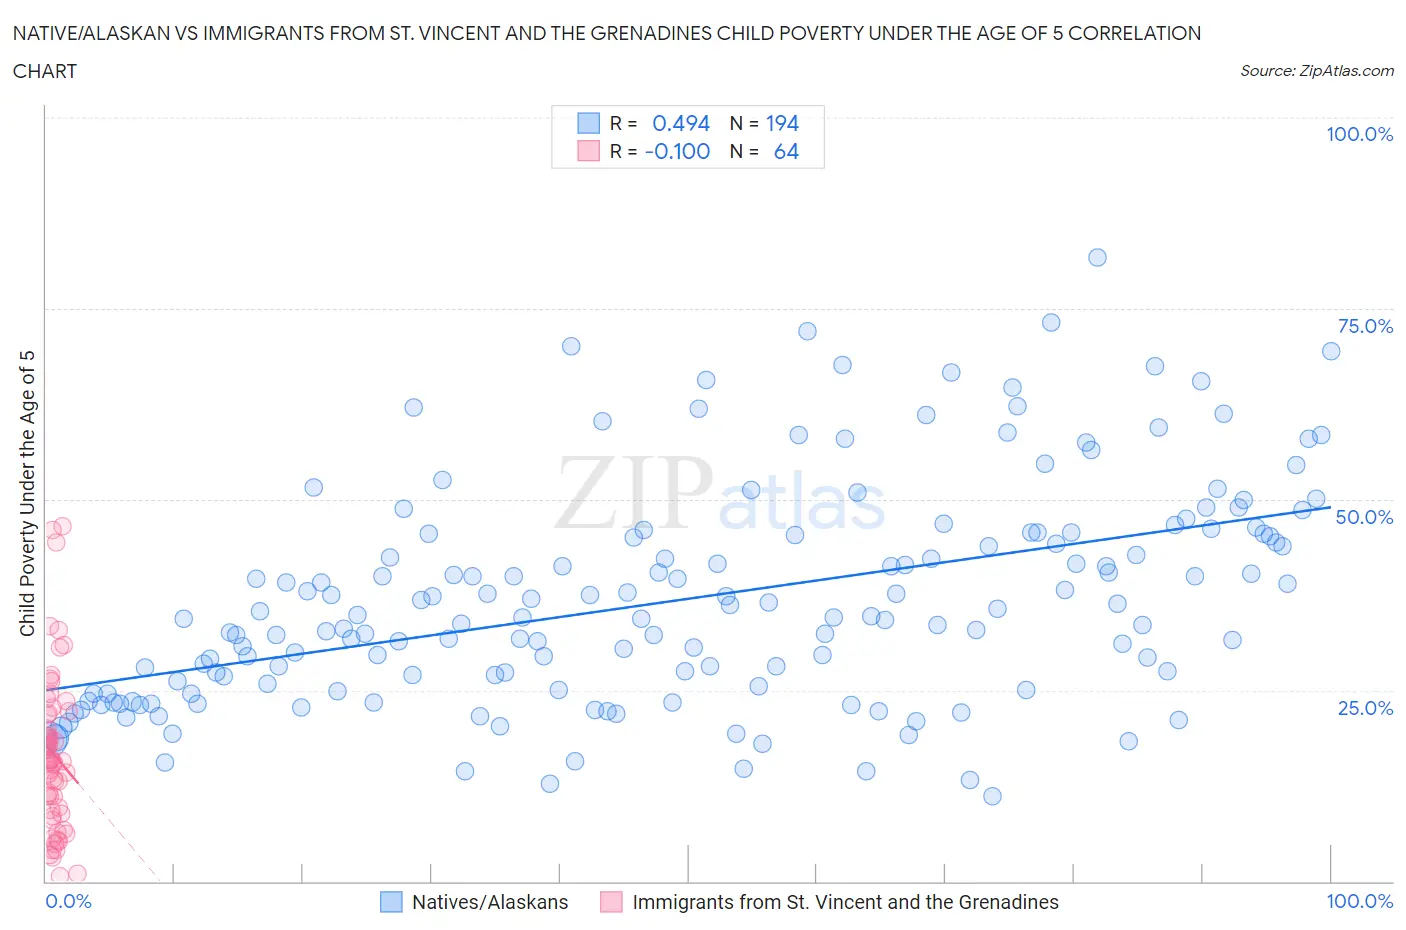
Native/Alaskan vs Immigrants from St. Vincent and the Grenadines Child Poverty Under the Age of 5 Correlation Chart
The statistical analysis conducted on geographies consisting of 489,584,863 people shows a moderate positive correlation between the proportion of Natives/Alaskans and poverty level among children under the age of 5 in the United States with a correlation coefficient (R) of 0.494 and weighted average of 25.6%. Similarly, the statistical analysis conducted on geographies consisting of 55,885,863 people shows a slight negative correlation between the proportion of Immigrants from St. Vincent and the Grenadines and poverty level among children under the age of 5 in the United States with a correlation coefficient (R) of -0.100 and weighted average of 20.0%, a difference of 27.8%.
Child Poverty Under the Age of 5 Correlation Summary
| Measurement | Native/Alaskan | Immigrants from St. Vincent and the Grenadines |
| Minimum | 11.1% | 0.65% |
| Maximum | 81.6% | 46.4% |
| Range | 70.5% | 45.8% |
| Mean | 36.9% | 16.6% |
| Median | 34.6% | 15.7% |
| Interquartile 25% (IQ1) | 25.6% | 9.1% |
| Interquartile 75% (IQ3) | 45.5% | 21.9% |
| Interquartile Range (IQR) | 19.9% | 12.8% |
| Standard Deviation (Sample) | 14.2% | 10.2% |
| Standard Deviation (Population) | 14.2% | 10.1% |
Similar Demographics by Child Poverty Under the Age of 5
Demographics Similar to Natives/Alaskans by Child Poverty Under the Age of 5
In terms of child poverty under the age of 5, the demographic groups most similar to Natives/Alaskans are Black/African American (25.7%, a difference of 0.50%), Colville (25.7%, a difference of 0.50%), Apache (25.0%, a difference of 2.2%), Kiowa (24.5%, a difference of 4.5%), and Sioux (26.9%, a difference of 5.4%).
| Demographics | Rating | Rank | Child Poverty Under the Age of 5 |
| Central American Indians | 0.0 /100 | #326 | Tragic 23.9% |
| Dominicans | 0.0 /100 | #327 | Tragic 24.0% |
| Immigrants | Dominican Republic | 0.0 /100 | #328 | Tragic 24.1% |
| Cajuns | 0.0 /100 | #329 | Tragic 24.1% |
| Creek | 0.0 /100 | #330 | Tragic 24.2% |
| Kiowa | 0.0 /100 | #331 | Tragic 24.5% |
| Apache | 0.0 /100 | #332 | Tragic 25.0% |
| Natives/Alaskans | 0.0 /100 | #333 | Tragic 25.6% |
| Blacks/African Americans | 0.0 /100 | #334 | Tragic 25.7% |
| Colville | 0.0 /100 | #335 | Tragic 25.7% |
| Sioux | 0.0 /100 | #336 | Tragic 26.9% |
| Pima | 0.0 /100 | #337 | Tragic 27.4% |
| Hopi | 0.0 /100 | #338 | Tragic 27.7% |
| Yup'ik | 0.0 /100 | #339 | Tragic 27.7% |
| Cheyenne | 0.0 /100 | #340 | Tragic 28.3% |
Demographics Similar to Immigrants from St. Vincent and the Grenadines by Child Poverty Under the Age of 5
In terms of child poverty under the age of 5, the demographic groups most similar to Immigrants from St. Vincent and the Grenadines are Immigrants from El Salvador (20.0%, a difference of 0.030%), Shoshone (20.0%, a difference of 0.14%), Immigrants from Barbados (20.0%, a difference of 0.15%), Immigrants from Cuba (19.9%, a difference of 0.37%), and Spanish American (20.1%, a difference of 0.43%).
| Demographics | Rating | Rank | Child Poverty Under the Age of 5 |
| Pennsylvania Germans | 0.3 /100 | #251 | Tragic 19.8% |
| Immigrants | Nicaragua | 0.3 /100 | #252 | Tragic 19.8% |
| Mexican American Indians | 0.3 /100 | #253 | Tragic 19.9% |
| Fijians | 0.3 /100 | #254 | Tragic 19.9% |
| Immigrants | Cuba | 0.2 /100 | #255 | Tragic 19.9% |
| Immigrants | Barbados | 0.2 /100 | #256 | Tragic 20.0% |
| Shoshone | 0.2 /100 | #257 | Tragic 20.0% |
| Immigrants | St. Vincent and the Grenadines | 0.2 /100 | #258 | Tragic 20.0% |
| Immigrants | El Salvador | 0.2 /100 | #259 | Tragic 20.0% |
| Spanish Americans | 0.2 /100 | #260 | Tragic 20.1% |
| Immigrants | Bangladesh | 0.2 /100 | #261 | Tragic 20.1% |
| Liberians | 0.1 /100 | #262 | Tragic 20.2% |
| Barbadians | 0.1 /100 | #263 | Tragic 20.2% |
| Immigrants | Liberia | 0.1 /100 | #264 | Tragic 20.2% |
| Spanish American Indians | 0.1 /100 | #265 | Tragic 20.2% |