Native Hawaiian vs Immigrants from Lithuania Child Poverty Under the Age of 5
COMPARE
Native Hawaiian
Immigrants from Lithuania
Child Poverty Under the Age of 5
Child Poverty Under the Age of 5 Comparison
Native Hawaiians
Immigrants from Lithuania
16.2%
CHILD POVERTY UNDER THE AGE OF 5
91.8/ 100
METRIC RATING
125th/ 347
METRIC RANK
14.1%
CHILD POVERTY UNDER THE AGE OF 5
99.9/ 100
METRIC RATING
26th/ 347
METRIC RANK
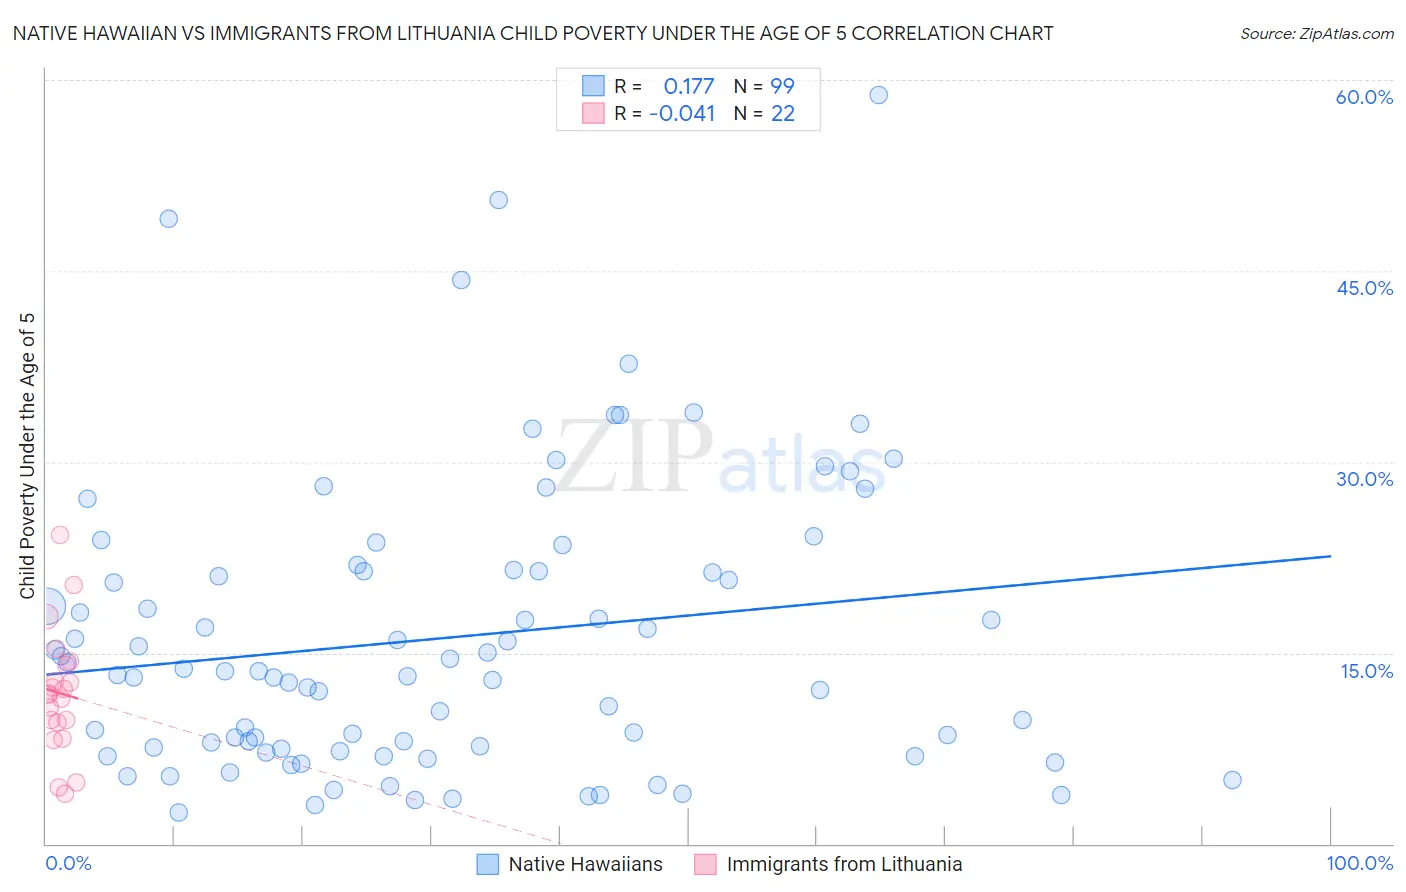
Native Hawaiian vs Immigrants from Lithuania Child Poverty Under the Age of 5 Correlation Chart
The statistical analysis conducted on geographies consisting of 323,152,225 people shows a poor positive correlation between the proportion of Native Hawaiians and poverty level among children under the age of 5 in the United States with a correlation coefficient (R) of 0.177 and weighted average of 16.2%. Similarly, the statistical analysis conducted on geographies consisting of 114,250,981 people shows no correlation between the proportion of Immigrants from Lithuania and poverty level among children under the age of 5 in the United States with a correlation coefficient (R) of -0.041 and weighted average of 14.1%, a difference of 14.6%.
Child Poverty Under the Age of 5 Correlation Summary
| Measurement | Native Hawaiian | Immigrants from Lithuania |
| Minimum | 2.4% | 3.9% |
| Maximum | 58.8% | 24.3% |
| Range | 56.4% | 20.4% |
| Mean | 16.1% | 11.8% |
| Median | 13.5% | 11.7% |
| Interquartile 25% (IQ1) | 7.5% | 9.6% |
| Interquartile 75% (IQ3) | 21.4% | 14.1% |
| Interquartile Range (IQR) | 13.9% | 4.5% |
| Standard Deviation (Sample) | 11.3% | 4.9% |
| Standard Deviation (Population) | 11.3% | 4.8% |
Similar Demographics by Child Poverty Under the Age of 5
Demographics Similar to Native Hawaiians by Child Poverty Under the Age of 5
In terms of child poverty under the age of 5, the demographic groups most similar to Native Hawaiians are Immigrants from Albania (16.2%, a difference of 0.0%), Swiss (16.1%, a difference of 0.070%), Austrian (16.1%, a difference of 0.080%), Immigrants from England (16.2%, a difference of 0.090%), and Immigrants from Southern Europe (16.1%, a difference of 0.10%).
| Demographics | Rating | Rank | Child Poverty Under the Age of 5 |
| Immigrants | Denmark | 93.4 /100 | #118 | Exceptional 16.0% |
| Immigrants | Jordan | 93.2 /100 | #119 | Exceptional 16.1% |
| Immigrants | Peru | 92.6 /100 | #120 | Exceptional 16.1% |
| Mongolians | 92.5 /100 | #121 | Exceptional 16.1% |
| Immigrants | Southern Europe | 92.0 /100 | #122 | Exceptional 16.1% |
| Austrians | 92.0 /100 | #123 | Exceptional 16.1% |
| Swiss | 92.0 /100 | #124 | Exceptional 16.1% |
| Native Hawaiians | 91.8 /100 | #125 | Exceptional 16.2% |
| Immigrants | Albania | 91.8 /100 | #126 | Exceptional 16.2% |
| Immigrants | England | 91.5 /100 | #127 | Exceptional 16.2% |
| South Africans | 90.1 /100 | #128 | Exceptional 16.2% |
| British | 89.4 /100 | #129 | Excellent 16.3% |
| Immigrants | Norway | 89.3 /100 | #130 | Excellent 16.3% |
| Finns | 88.3 /100 | #131 | Excellent 16.3% |
| Serbians | 88.2 /100 | #132 | Excellent 16.3% |
Demographics Similar to Immigrants from Lithuania by Child Poverty Under the Age of 5
In terms of child poverty under the age of 5, the demographic groups most similar to Immigrants from Lithuania are Tongan (14.2%, a difference of 0.49%), Asian (14.0%, a difference of 0.93%), Cypriot (14.0%, a difference of 0.93%), Bulgarian (13.9%, a difference of 1.5%), and Immigrants from Indonesia (14.3%, a difference of 1.7%).
| Demographics | Rating | Rank | Child Poverty Under the Age of 5 |
| Immigrants | Ireland | 100.0 /100 | #19 | Exceptional 13.7% |
| Immigrants | Japan | 100.0 /100 | #20 | Exceptional 13.8% |
| Bolivians | 100.0 /100 | #21 | Exceptional 13.8% |
| Immigrants | Bolivia | 100.0 /100 | #22 | Exceptional 13.8% |
| Bulgarians | 99.9 /100 | #23 | Exceptional 13.9% |
| Asians | 99.9 /100 | #24 | Exceptional 14.0% |
| Cypriots | 99.9 /100 | #25 | Exceptional 14.0% |
| Immigrants | Lithuania | 99.9 /100 | #26 | Exceptional 14.1% |
| Tongans | 99.9 /100 | #27 | Exceptional 14.2% |
| Immigrants | Indonesia | 99.8 /100 | #28 | Exceptional 14.3% |
| Immigrants | Asia | 99.8 /100 | #29 | Exceptional 14.4% |
| Cambodians | 99.8 /100 | #30 | Exceptional 14.4% |
| Koreans | 99.8 /100 | #31 | Exceptional 14.4% |
| Immigrants | Sri Lanka | 99.8 /100 | #32 | Exceptional 14.4% |
| Taiwanese | 99.8 /100 | #33 | Exceptional 14.5% |