Immigrants from El Salvador vs Immigrants from Lithuania Child Poverty Under the Age of 5
COMPARE
Immigrants from El Salvador
Immigrants from Lithuania
Child Poverty Under the Age of 5
Child Poverty Under the Age of 5 Comparison
Immigrants from El Salvador
Immigrants from Lithuania
20.0%
CHILD POVERTY UNDER THE AGE OF 5
0.2/ 100
METRIC RATING
259th/ 347
METRIC RANK
14.1%
CHILD POVERTY UNDER THE AGE OF 5
99.9/ 100
METRIC RATING
26th/ 347
METRIC RANK
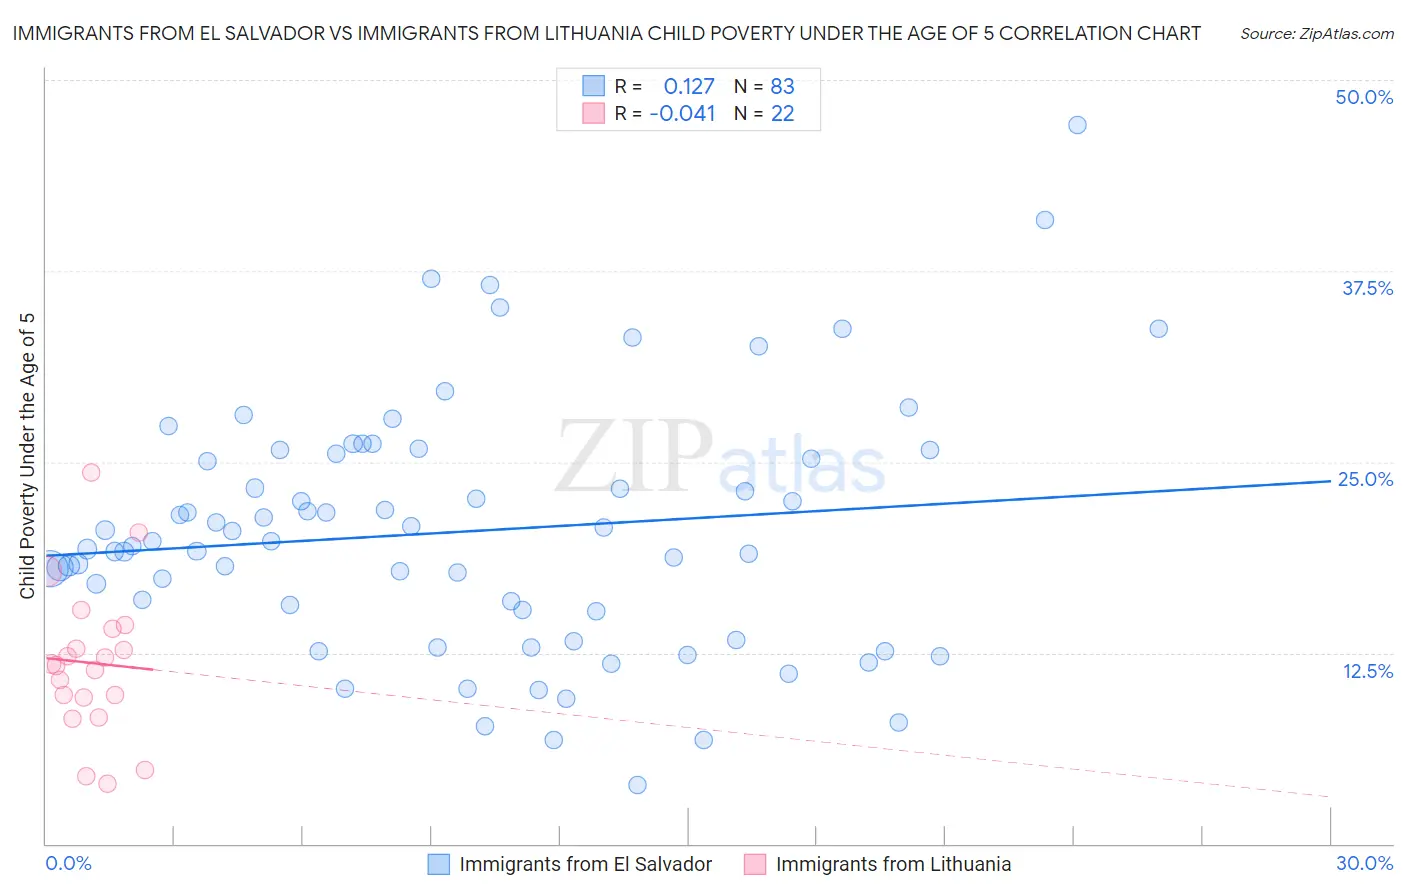
Immigrants from El Salvador vs Immigrants from Lithuania Child Poverty Under the Age of 5 Correlation Chart
The statistical analysis conducted on geographies consisting of 348,349,886 people shows a poor positive correlation between the proportion of Immigrants from El Salvador and poverty level among children under the age of 5 in the United States with a correlation coefficient (R) of 0.127 and weighted average of 20.0%. Similarly, the statistical analysis conducted on geographies consisting of 114,250,981 people shows no correlation between the proportion of Immigrants from Lithuania and poverty level among children under the age of 5 in the United States with a correlation coefficient (R) of -0.041 and weighted average of 14.1%, a difference of 41.9%.
Child Poverty Under the Age of 5 Correlation Summary
| Measurement | Immigrants from El Salvador | Immigrants from Lithuania |
| Minimum | 3.8% | 3.9% |
| Maximum | 47.0% | 24.3% |
| Range | 43.2% | 20.4% |
| Mean | 20.4% | 11.8% |
| Median | 19.8% | 11.7% |
| Interquartile 25% (IQ1) | 15.2% | 9.6% |
| Interquartile 75% (IQ3) | 25.5% | 14.1% |
| Interquartile Range (IQR) | 10.3% | 4.5% |
| Standard Deviation (Sample) | 8.2% | 4.9% |
| Standard Deviation (Population) | 8.1% | 4.8% |
Similar Demographics by Child Poverty Under the Age of 5
Demographics Similar to Immigrants from El Salvador by Child Poverty Under the Age of 5
In terms of child poverty under the age of 5, the demographic groups most similar to Immigrants from El Salvador are Immigrants from St. Vincent and the Grenadines (20.0%, a difference of 0.030%), Shoshone (20.0%, a difference of 0.16%), Immigrants from Barbados (20.0%, a difference of 0.17%), Immigrants from Cuba (19.9%, a difference of 0.39%), and Spanish American (20.1%, a difference of 0.40%).
| Demographics | Rating | Rank | Child Poverty Under the Age of 5 |
| Immigrants | Nicaragua | 0.3 /100 | #252 | Tragic 19.8% |
| Mexican American Indians | 0.3 /100 | #253 | Tragic 19.9% |
| Fijians | 0.3 /100 | #254 | Tragic 19.9% |
| Immigrants | Cuba | 0.2 /100 | #255 | Tragic 19.9% |
| Immigrants | Barbados | 0.2 /100 | #256 | Tragic 20.0% |
| Shoshone | 0.2 /100 | #257 | Tragic 20.0% |
| Immigrants | St. Vincent and the Grenadines | 0.2 /100 | #258 | Tragic 20.0% |
| Immigrants | El Salvador | 0.2 /100 | #259 | Tragic 20.0% |
| Spanish Americans | 0.2 /100 | #260 | Tragic 20.1% |
| Immigrants | Bangladesh | 0.2 /100 | #261 | Tragic 20.1% |
| Liberians | 0.1 /100 | #262 | Tragic 20.2% |
| Barbadians | 0.1 /100 | #263 | Tragic 20.2% |
| Immigrants | Liberia | 0.1 /100 | #264 | Tragic 20.2% |
| Spanish American Indians | 0.1 /100 | #265 | Tragic 20.2% |
| Aleuts | 0.1 /100 | #266 | Tragic 20.3% |
Demographics Similar to Immigrants from Lithuania by Child Poverty Under the Age of 5
In terms of child poverty under the age of 5, the demographic groups most similar to Immigrants from Lithuania are Tongan (14.2%, a difference of 0.49%), Asian (14.0%, a difference of 0.93%), Cypriot (14.0%, a difference of 0.93%), Bulgarian (13.9%, a difference of 1.5%), and Immigrants from Indonesia (14.3%, a difference of 1.7%).
| Demographics | Rating | Rank | Child Poverty Under the Age of 5 |
| Immigrants | Ireland | 100.0 /100 | #19 | Exceptional 13.7% |
| Immigrants | Japan | 100.0 /100 | #20 | Exceptional 13.8% |
| Bolivians | 100.0 /100 | #21 | Exceptional 13.8% |
| Immigrants | Bolivia | 100.0 /100 | #22 | Exceptional 13.8% |
| Bulgarians | 99.9 /100 | #23 | Exceptional 13.9% |
| Asians | 99.9 /100 | #24 | Exceptional 14.0% |
| Cypriots | 99.9 /100 | #25 | Exceptional 14.0% |
| Immigrants | Lithuania | 99.9 /100 | #26 | Exceptional 14.1% |
| Tongans | 99.9 /100 | #27 | Exceptional 14.2% |
| Immigrants | Indonesia | 99.8 /100 | #28 | Exceptional 14.3% |
| Immigrants | Asia | 99.8 /100 | #29 | Exceptional 14.4% |
| Cambodians | 99.8 /100 | #30 | Exceptional 14.4% |
| Koreans | 99.8 /100 | #31 | Exceptional 14.4% |
| Immigrants | Sri Lanka | 99.8 /100 | #32 | Exceptional 14.4% |
| Taiwanese | 99.8 /100 | #33 | Exceptional 14.5% |