Nepalese vs Immigrants from Lithuania Child Poverty Under the Age of 5
COMPARE
Nepalese
Immigrants from Lithuania
Child Poverty Under the Age of 5
Child Poverty Under the Age of 5 Comparison
Nepalese
Immigrants from Lithuania
18.3%
CHILD POVERTY UNDER THE AGE OF 5
8.7/ 100
METRIC RATING
212th/ 347
METRIC RANK
14.1%
CHILD POVERTY UNDER THE AGE OF 5
99.9/ 100
METRIC RATING
26th/ 347
METRIC RANK
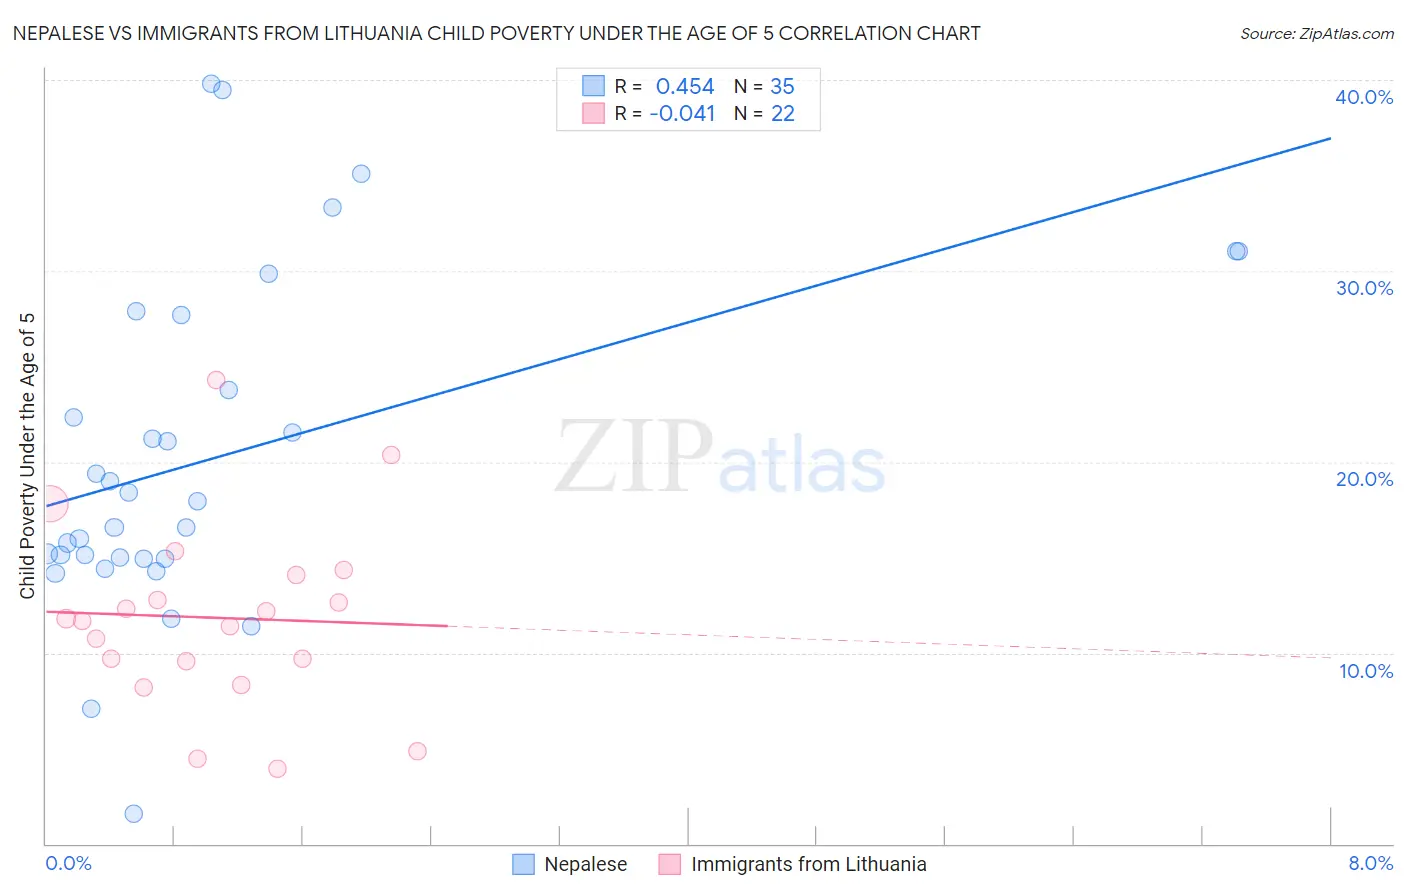
Nepalese vs Immigrants from Lithuania Child Poverty Under the Age of 5 Correlation Chart
The statistical analysis conducted on geographies consisting of 24,301,294 people shows a moderate positive correlation between the proportion of Nepalese and poverty level among children under the age of 5 in the United States with a correlation coefficient (R) of 0.454 and weighted average of 18.3%. Similarly, the statistical analysis conducted on geographies consisting of 114,250,981 people shows no correlation between the proportion of Immigrants from Lithuania and poverty level among children under the age of 5 in the United States with a correlation coefficient (R) of -0.041 and weighted average of 14.1%, a difference of 29.7%.
Child Poverty Under the Age of 5 Correlation Summary
| Measurement | Nepalese | Immigrants from Lithuania |
| Minimum | 1.6% | 3.9% |
| Maximum | 39.8% | 24.3% |
| Range | 38.2% | 20.4% |
| Mean | 20.3% | 11.8% |
| Median | 18.0% | 11.7% |
| Interquartile 25% (IQ1) | 15.0% | 9.6% |
| Interquartile 75% (IQ3) | 27.7% | 14.1% |
| Interquartile Range (IQR) | 12.7% | 4.5% |
| Standard Deviation (Sample) | 8.8% | 4.9% |
| Standard Deviation (Population) | 8.7% | 4.8% |
Similar Demographics by Child Poverty Under the Age of 5
Demographics Similar to Nepalese by Child Poverty Under the Age of 5
In terms of child poverty under the age of 5, the demographic groups most similar to Nepalese are Immigrants from Thailand (18.3%, a difference of 0.020%), Moroccan (18.2%, a difference of 0.21%), Panamanian (18.2%, a difference of 0.30%), Spanish (18.2%, a difference of 0.31%), and Scotch-Irish (18.2%, a difference of 0.32%).
| Demographics | Rating | Rank | Child Poverty Under the Age of 5 |
| Spaniards | 12.8 /100 | #205 | Poor 18.1% |
| Whites/Caucasians | 12.6 /100 | #206 | Poor 18.1% |
| Immigrants | Immigrants | 9.9 /100 | #207 | Tragic 18.2% |
| Scotch-Irish | 9.8 /100 | #208 | Tragic 18.2% |
| Spanish | 9.8 /100 | #209 | Tragic 18.2% |
| Panamanians | 9.7 /100 | #210 | Tragic 18.2% |
| Moroccans | 9.4 /100 | #211 | Tragic 18.2% |
| Nepalese | 8.7 /100 | #212 | Tragic 18.3% |
| Immigrants | Thailand | 8.6 /100 | #213 | Tragic 18.3% |
| Malaysians | 6.5 /100 | #214 | Tragic 18.4% |
| Immigrants | Panama | 6.0 /100 | #215 | Tragic 18.5% |
| Hmong | 5.0 /100 | #216 | Tragic 18.5% |
| Immigrants | Africa | 4.6 /100 | #217 | Tragic 18.6% |
| Delaware | 3.4 /100 | #218 | Tragic 18.7% |
| German Russians | 3.0 /100 | #219 | Tragic 18.8% |
Demographics Similar to Immigrants from Lithuania by Child Poverty Under the Age of 5
In terms of child poverty under the age of 5, the demographic groups most similar to Immigrants from Lithuania are Tongan (14.2%, a difference of 0.49%), Asian (14.0%, a difference of 0.93%), Cypriot (14.0%, a difference of 0.93%), Bulgarian (13.9%, a difference of 1.5%), and Immigrants from Indonesia (14.3%, a difference of 1.7%).
| Demographics | Rating | Rank | Child Poverty Under the Age of 5 |
| Immigrants | Ireland | 100.0 /100 | #19 | Exceptional 13.7% |
| Immigrants | Japan | 100.0 /100 | #20 | Exceptional 13.8% |
| Bolivians | 100.0 /100 | #21 | Exceptional 13.8% |
| Immigrants | Bolivia | 100.0 /100 | #22 | Exceptional 13.8% |
| Bulgarians | 99.9 /100 | #23 | Exceptional 13.9% |
| Asians | 99.9 /100 | #24 | Exceptional 14.0% |
| Cypriots | 99.9 /100 | #25 | Exceptional 14.0% |
| Immigrants | Lithuania | 99.9 /100 | #26 | Exceptional 14.1% |
| Tongans | 99.9 /100 | #27 | Exceptional 14.2% |
| Immigrants | Indonesia | 99.8 /100 | #28 | Exceptional 14.3% |
| Immigrants | Asia | 99.8 /100 | #29 | Exceptional 14.4% |
| Cambodians | 99.8 /100 | #30 | Exceptional 14.4% |
| Koreans | 99.8 /100 | #31 | Exceptional 14.4% |
| Immigrants | Sri Lanka | 99.8 /100 | #32 | Exceptional 14.4% |
| Taiwanese | 99.8 /100 | #33 | Exceptional 14.5% |