Native Hawaiian vs Immigrants from Grenada Child Poverty Under the Age of 5
COMPARE
Native Hawaiian
Immigrants from Grenada
Child Poverty Under the Age of 5
Child Poverty Under the Age of 5 Comparison
Native Hawaiians
Immigrants from Grenada
16.2%
CHILD POVERTY UNDER THE AGE OF 5
91.8/ 100
METRIC RATING
125th/ 347
METRIC RANK
20.7%
CHILD POVERTY UNDER THE AGE OF 5
0.0/ 100
METRIC RATING
278th/ 347
METRIC RANK
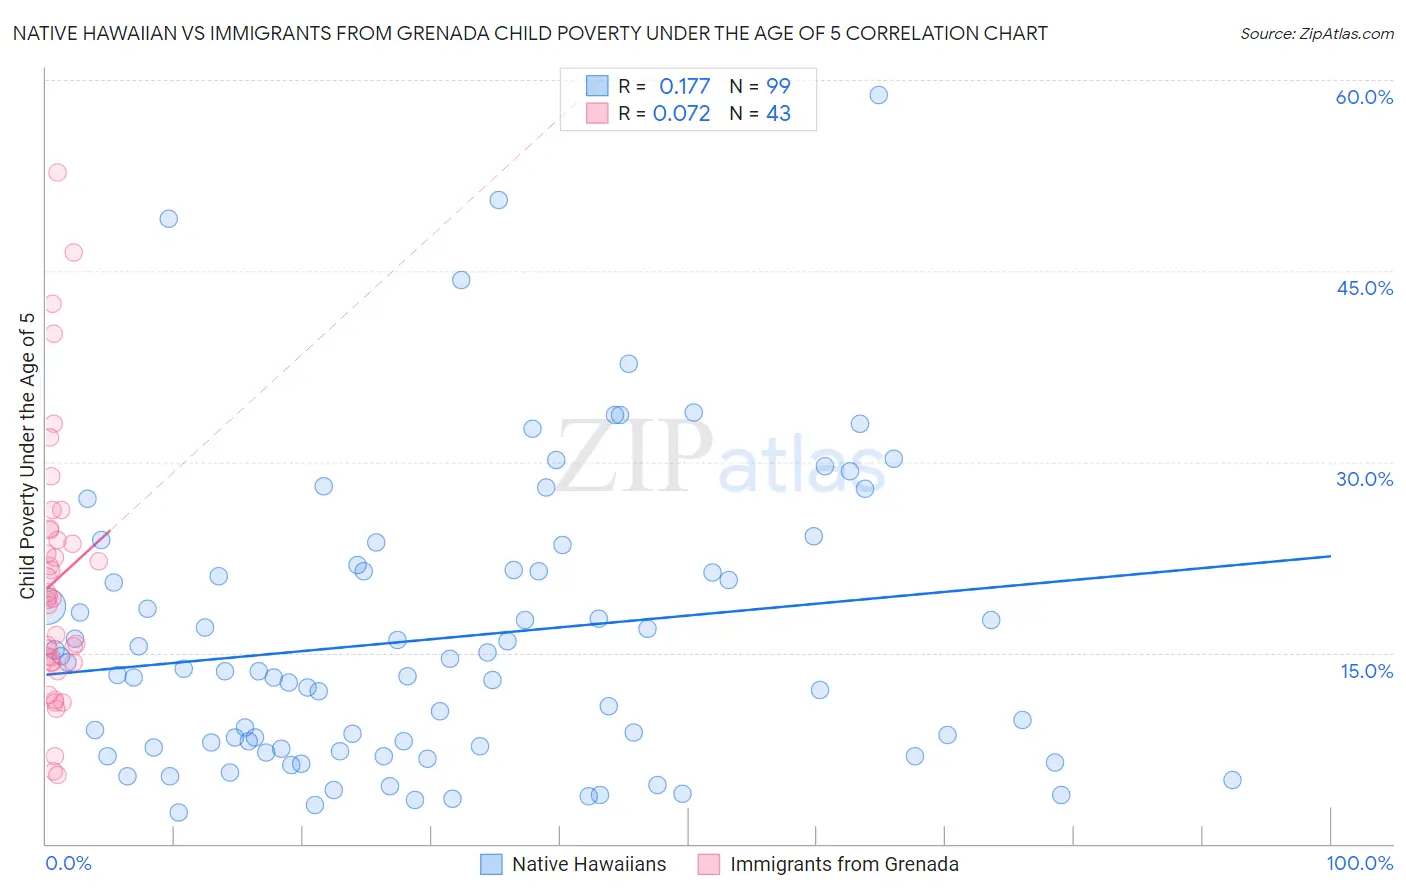
Native Hawaiian vs Immigrants from Grenada Child Poverty Under the Age of 5 Correlation Chart
The statistical analysis conducted on geographies consisting of 323,152,225 people shows a poor positive correlation between the proportion of Native Hawaiians and poverty level among children under the age of 5 in the United States with a correlation coefficient (R) of 0.177 and weighted average of 16.2%. Similarly, the statistical analysis conducted on geographies consisting of 66,612,136 people shows a slight positive correlation between the proportion of Immigrants from Grenada and poverty level among children under the age of 5 in the United States with a correlation coefficient (R) of 0.072 and weighted average of 20.7%, a difference of 28.0%.
Child Poverty Under the Age of 5 Correlation Summary
| Measurement | Native Hawaiian | Immigrants from Grenada |
| Minimum | 2.4% | 5.4% |
| Maximum | 58.8% | 52.7% |
| Range | 56.4% | 47.3% |
| Mean | 16.1% | 20.7% |
| Median | 13.5% | 19.3% |
| Interquartile 25% (IQ1) | 7.5% | 14.2% |
| Interquartile 75% (IQ3) | 21.4% | 24.7% |
| Interquartile Range (IQR) | 13.9% | 10.5% |
| Standard Deviation (Sample) | 11.3% | 10.3% |
| Standard Deviation (Population) | 11.3% | 10.2% |
Similar Demographics by Child Poverty Under the Age of 5
Demographics Similar to Native Hawaiians by Child Poverty Under the Age of 5
In terms of child poverty under the age of 5, the demographic groups most similar to Native Hawaiians are Immigrants from Albania (16.2%, a difference of 0.0%), Swiss (16.1%, a difference of 0.070%), Austrian (16.1%, a difference of 0.080%), Immigrants from England (16.2%, a difference of 0.090%), and Immigrants from Southern Europe (16.1%, a difference of 0.10%).
| Demographics | Rating | Rank | Child Poverty Under the Age of 5 |
| Immigrants | Denmark | 93.4 /100 | #118 | Exceptional 16.0% |
| Immigrants | Jordan | 93.2 /100 | #119 | Exceptional 16.1% |
| Immigrants | Peru | 92.6 /100 | #120 | Exceptional 16.1% |
| Mongolians | 92.5 /100 | #121 | Exceptional 16.1% |
| Immigrants | Southern Europe | 92.0 /100 | #122 | Exceptional 16.1% |
| Austrians | 92.0 /100 | #123 | Exceptional 16.1% |
| Swiss | 92.0 /100 | #124 | Exceptional 16.1% |
| Native Hawaiians | 91.8 /100 | #125 | Exceptional 16.2% |
| Immigrants | Albania | 91.8 /100 | #126 | Exceptional 16.2% |
| Immigrants | England | 91.5 /100 | #127 | Exceptional 16.2% |
| South Africans | 90.1 /100 | #128 | Exceptional 16.2% |
| British | 89.4 /100 | #129 | Excellent 16.3% |
| Immigrants | Norway | 89.3 /100 | #130 | Excellent 16.3% |
| Finns | 88.3 /100 | #131 | Excellent 16.3% |
| Serbians | 88.2 /100 | #132 | Excellent 16.3% |
Demographics Similar to Immigrants from Grenada by Child Poverty Under the Age of 5
In terms of child poverty under the age of 5, the demographic groups most similar to Immigrants from Grenada are Immigrants from West Indies (20.7%, a difference of 0.020%), West Indian (20.6%, a difference of 0.19%), Bangladeshi (20.6%, a difference of 0.28%), Immigrants from Belize (20.6%, a difference of 0.33%), and Subsaharan African (20.8%, a difference of 0.37%).
| Demographics | Rating | Rank | Child Poverty Under the Age of 5 |
| Americans | 0.1 /100 | #271 | Tragic 20.5% |
| Immigrants | Jamaica | 0.1 /100 | #272 | Tragic 20.5% |
| Central Americans | 0.1 /100 | #273 | Tragic 20.6% |
| Immigrants | Belize | 0.1 /100 | #274 | Tragic 20.6% |
| Bangladeshis | 0.1 /100 | #275 | Tragic 20.6% |
| West Indians | 0.0 /100 | #276 | Tragic 20.6% |
| Immigrants | West Indies | 0.0 /100 | #277 | Tragic 20.7% |
| Immigrants | Grenada | 0.0 /100 | #278 | Tragic 20.7% |
| Sub-Saharan Africans | 0.0 /100 | #279 | Tragic 20.8% |
| French American Indians | 0.0 /100 | #280 | Tragic 20.8% |
| Senegalese | 0.0 /100 | #281 | Tragic 20.9% |
| Potawatomi | 0.0 /100 | #282 | Tragic 21.0% |
| Comanche | 0.0 /100 | #283 | Tragic 21.0% |
| Somalis | 0.0 /100 | #284 | Tragic 21.1% |
| Haitians | 0.0 /100 | #285 | Tragic 21.2% |