Native Hawaiian vs Immigrants from Iran Child Poverty Under the Age of 5
COMPARE
Native Hawaiian
Immigrants from Iran
Child Poverty Under the Age of 5
Child Poverty Under the Age of 5 Comparison
Native Hawaiians
Immigrants from Iran
16.2%
CHILD POVERTY UNDER THE AGE OF 5
91.8/ 100
METRIC RATING
125th/ 347
METRIC RANK
13.1%
CHILD POVERTY UNDER THE AGE OF 5
100.0/ 100
METRIC RATING
9th/ 347
METRIC RANK
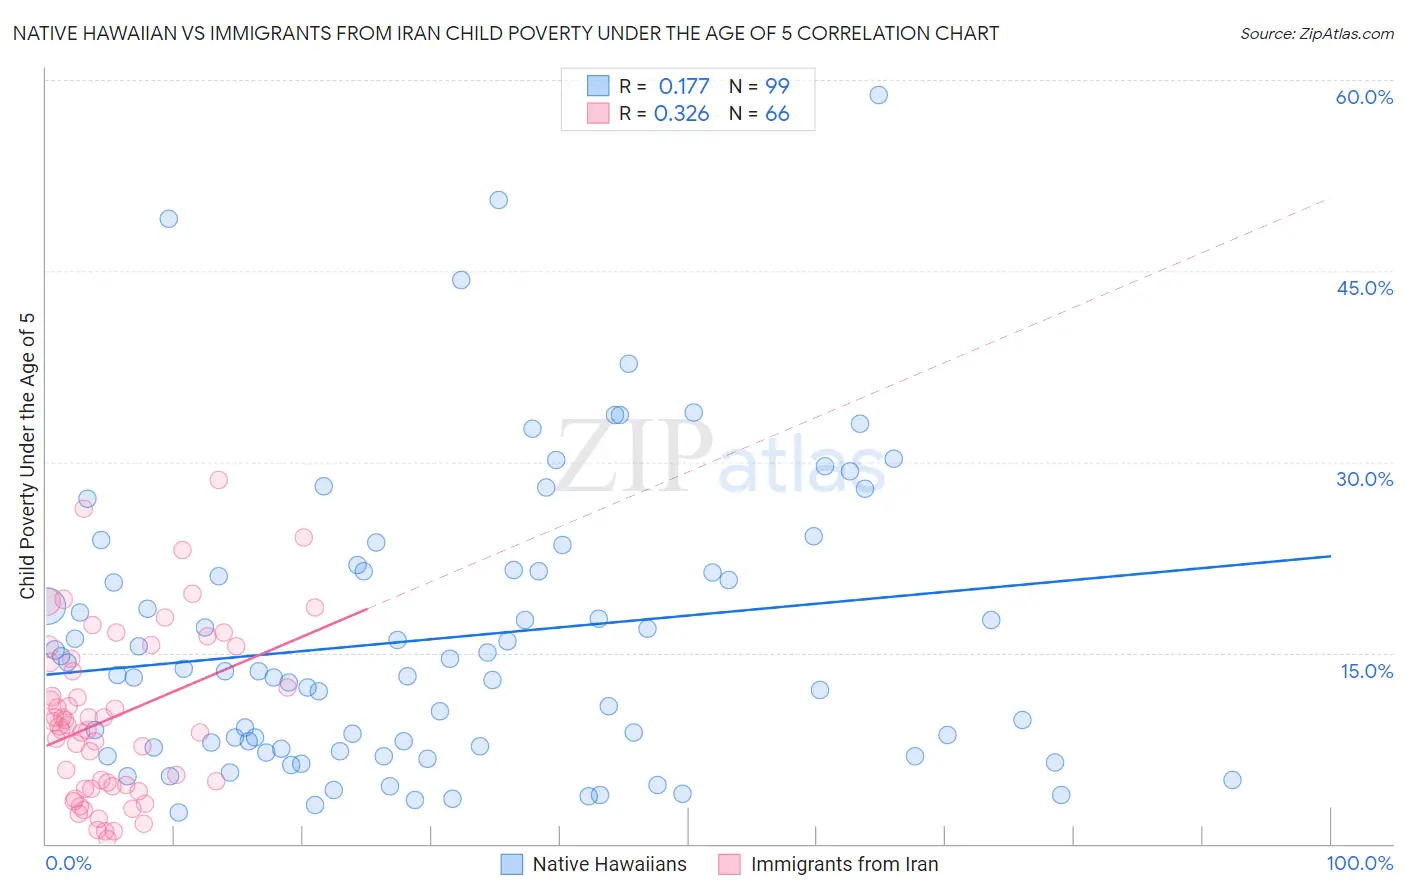
Native Hawaiian vs Immigrants from Iran Child Poverty Under the Age of 5 Correlation Chart
The statistical analysis conducted on geographies consisting of 323,152,225 people shows a poor positive correlation between the proportion of Native Hawaiians and poverty level among children under the age of 5 in the United States with a correlation coefficient (R) of 0.177 and weighted average of 16.2%. Similarly, the statistical analysis conducted on geographies consisting of 269,372,648 people shows a mild positive correlation between the proportion of Immigrants from Iran and poverty level among children under the age of 5 in the United States with a correlation coefficient (R) of 0.326 and weighted average of 13.1%, a difference of 23.5%.
Child Poverty Under the Age of 5 Correlation Summary
| Measurement | Native Hawaiian | Immigrants from Iran |
| Minimum | 2.4% | 0.42% |
| Maximum | 58.8% | 28.6% |
| Range | 56.4% | 28.2% |
| Mean | 16.1% | 10.0% |
| Median | 13.5% | 9.3% |
| Interquartile 25% (IQ1) | 7.5% | 4.6% |
| Interquartile 75% (IQ3) | 21.4% | 14.6% |
| Interquartile Range (IQR) | 13.9% | 10.0% |
| Standard Deviation (Sample) | 11.3% | 6.6% |
| Standard Deviation (Population) | 11.3% | 6.5% |
Similar Demographics by Child Poverty Under the Age of 5
Demographics Similar to Native Hawaiians by Child Poverty Under the Age of 5
In terms of child poverty under the age of 5, the demographic groups most similar to Native Hawaiians are Immigrants from Albania (16.2%, a difference of 0.0%), Swiss (16.1%, a difference of 0.070%), Austrian (16.1%, a difference of 0.080%), Immigrants from England (16.2%, a difference of 0.090%), and Immigrants from Southern Europe (16.1%, a difference of 0.10%).
| Demographics | Rating | Rank | Child Poverty Under the Age of 5 |
| Immigrants | Denmark | 93.4 /100 | #118 | Exceptional 16.0% |
| Immigrants | Jordan | 93.2 /100 | #119 | Exceptional 16.1% |
| Immigrants | Peru | 92.6 /100 | #120 | Exceptional 16.1% |
| Mongolians | 92.5 /100 | #121 | Exceptional 16.1% |
| Immigrants | Southern Europe | 92.0 /100 | #122 | Exceptional 16.1% |
| Austrians | 92.0 /100 | #123 | Exceptional 16.1% |
| Swiss | 92.0 /100 | #124 | Exceptional 16.1% |
| Native Hawaiians | 91.8 /100 | #125 | Exceptional 16.2% |
| Immigrants | Albania | 91.8 /100 | #126 | Exceptional 16.2% |
| Immigrants | England | 91.5 /100 | #127 | Exceptional 16.2% |
| South Africans | 90.1 /100 | #128 | Exceptional 16.2% |
| British | 89.4 /100 | #129 | Excellent 16.3% |
| Immigrants | Norway | 89.3 /100 | #130 | Excellent 16.3% |
| Finns | 88.3 /100 | #131 | Excellent 16.3% |
| Serbians | 88.2 /100 | #132 | Excellent 16.3% |
Demographics Similar to Immigrants from Iran by Child Poverty Under the Age of 5
In terms of child poverty under the age of 5, the demographic groups most similar to Immigrants from Iran are Iranian (13.1%, a difference of 0.16%), Chinese (13.1%, a difference of 0.17%), Burmese (13.2%, a difference of 1.1%), Immigrants from Singapore (12.9%, a difference of 1.2%), and Immigrants from Korea (13.2%, a difference of 1.2%).
| Demographics | Rating | Rank | Child Poverty Under the Age of 5 |
| Immigrants | Taiwan | 100.0 /100 | #2 | Exceptional 11.6% |
| Filipinos | 100.0 /100 | #3 | Exceptional 11.6% |
| Thais | 100.0 /100 | #4 | Exceptional 12.3% |
| Immigrants | Hong Kong | 100.0 /100 | #5 | Exceptional 12.4% |
| Immigrants | Singapore | 100.0 /100 | #6 | Exceptional 12.9% |
| Chinese | 100.0 /100 | #7 | Exceptional 13.1% |
| Iranians | 100.0 /100 | #8 | Exceptional 13.1% |
| Immigrants | Iran | 100.0 /100 | #9 | Exceptional 13.1% |
| Burmese | 100.0 /100 | #10 | Exceptional 13.2% |
| Immigrants | Korea | 100.0 /100 | #11 | Exceptional 13.2% |
| Immigrants | South Central Asia | 100.0 /100 | #12 | Exceptional 13.3% |
| Bhutanese | 100.0 /100 | #13 | Exceptional 13.4% |
| Okinawans | 100.0 /100 | #14 | Exceptional 13.4% |
| Indians (Asian) | 100.0 /100 | #15 | Exceptional 13.4% |
| Immigrants | Eastern Asia | 100.0 /100 | #16 | Exceptional 13.5% |