Dutch vs Immigrants from Lithuania Child Poverty Under the Age of 5
COMPARE
Dutch
Immigrants from Lithuania
Child Poverty Under the Age of 5
Child Poverty Under the Age of 5 Comparison
Dutch
Immigrants from Lithuania
16.7%
CHILD POVERTY UNDER THE AGE OF 5
77.1/ 100
METRIC RATING
153rd/ 347
METRIC RANK
14.1%
CHILD POVERTY UNDER THE AGE OF 5
99.9/ 100
METRIC RATING
26th/ 347
METRIC RANK
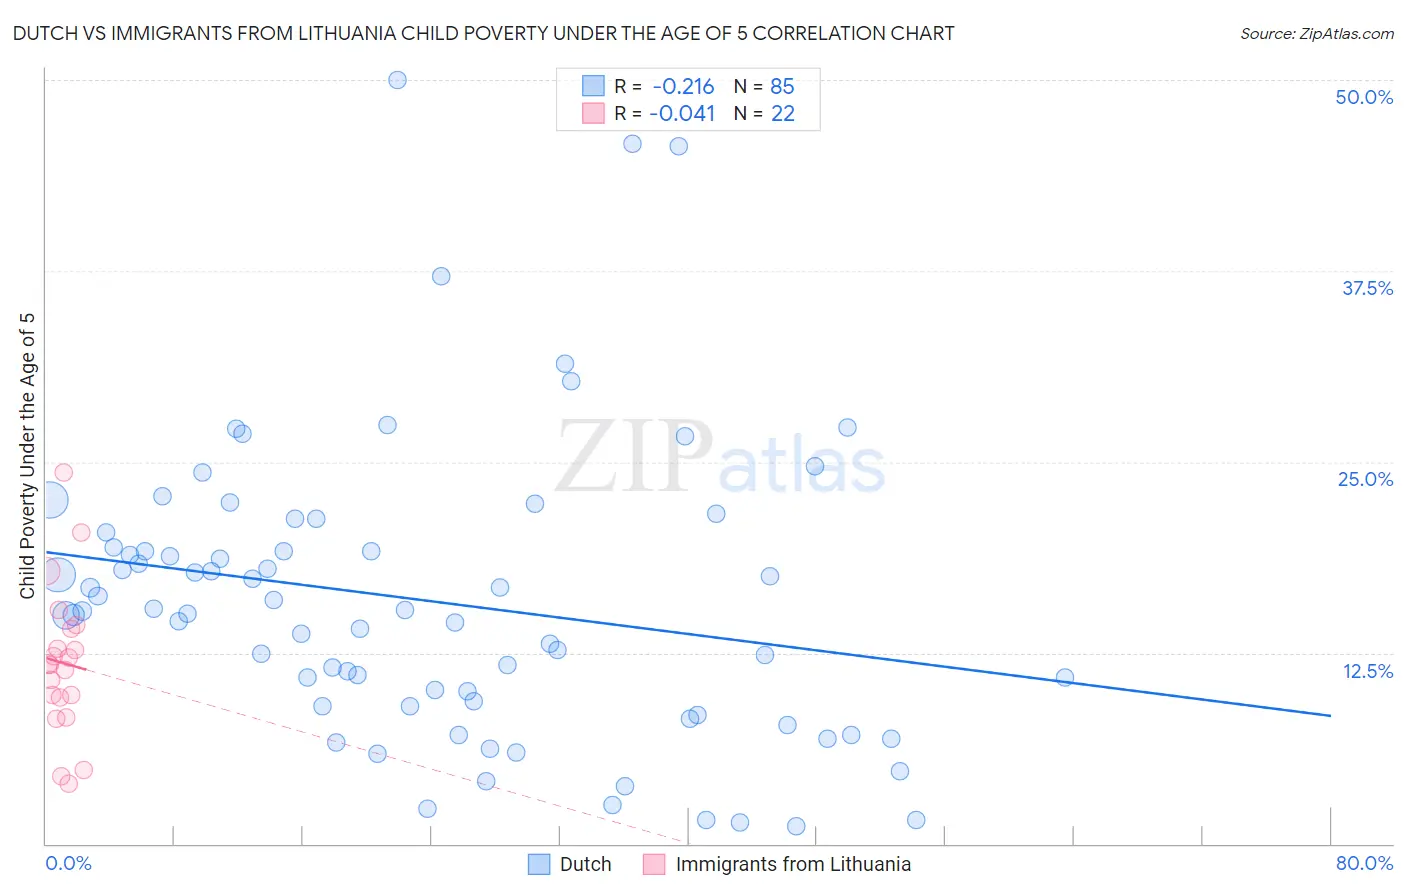
Dutch vs Immigrants from Lithuania Child Poverty Under the Age of 5 Correlation Chart
The statistical analysis conducted on geographies consisting of 516,653,968 people shows a weak negative correlation between the proportion of Dutch and poverty level among children under the age of 5 in the United States with a correlation coefficient (R) of -0.216 and weighted average of 16.7%. Similarly, the statistical analysis conducted on geographies consisting of 114,250,981 people shows no correlation between the proportion of Immigrants from Lithuania and poverty level among children under the age of 5 in the United States with a correlation coefficient (R) of -0.041 and weighted average of 14.1%, a difference of 18.4%.
Child Poverty Under the Age of 5 Correlation Summary
| Measurement | Dutch | Immigrants from Lithuania |
| Minimum | 1.2% | 3.9% |
| Maximum | 50.0% | 24.3% |
| Range | 48.8% | 20.4% |
| Mean | 15.9% | 11.8% |
| Median | 15.3% | 11.7% |
| Interquartile 25% (IQ1) | 9.0% | 9.6% |
| Interquartile 75% (IQ3) | 19.9% | 14.1% |
| Interquartile Range (IQR) | 10.9% | 4.5% |
| Standard Deviation (Sample) | 9.7% | 4.9% |
| Standard Deviation (Population) | 9.6% | 4.8% |
Similar Demographics by Child Poverty Under the Age of 5
Demographics Similar to Dutch by Child Poverty Under the Age of 5
In terms of child poverty under the age of 5, the demographic groups most similar to Dutch are Belgian (16.7%, a difference of 0.020%), Canadian (16.7%, a difference of 0.080%), Colombian (16.7%, a difference of 0.11%), Immigrants from Venezuela (16.7%, a difference of 0.16%), and New Zealander (16.6%, a difference of 0.26%).
| Demographics | Rating | Rank | Child Poverty Under the Age of 5 |
| Israelis | 82.0 /100 | #146 | Excellent 16.6% |
| Immigrants | Nepal | 80.3 /100 | #147 | Excellent 16.6% |
| Syrians | 79.1 /100 | #148 | Good 16.6% |
| New Zealanders | 78.7 /100 | #149 | Good 16.6% |
| Colombians | 77.8 /100 | #150 | Good 16.7% |
| Canadians | 77.6 /100 | #151 | Good 16.7% |
| Belgians | 77.2 /100 | #152 | Good 16.7% |
| Dutch | 77.1 /100 | #153 | Good 16.7% |
| Immigrants | Venezuela | 76.0 /100 | #154 | Good 16.7% |
| South Americans | 75.1 /100 | #155 | Good 16.7% |
| Afghans | 74.4 /100 | #156 | Good 16.8% |
| Venezuelans | 73.7 /100 | #157 | Good 16.8% |
| Czechoslovakians | 72.5 /100 | #158 | Good 16.8% |
| Immigrants | Syria | 72.3 /100 | #159 | Good 16.8% |
| Irish | 72.0 /100 | #160 | Good 16.8% |
Demographics Similar to Immigrants from Lithuania by Child Poverty Under the Age of 5
In terms of child poverty under the age of 5, the demographic groups most similar to Immigrants from Lithuania are Tongan (14.2%, a difference of 0.49%), Asian (14.0%, a difference of 0.93%), Cypriot (14.0%, a difference of 0.93%), Bulgarian (13.9%, a difference of 1.5%), and Immigrants from Indonesia (14.3%, a difference of 1.7%).
| Demographics | Rating | Rank | Child Poverty Under the Age of 5 |
| Immigrants | Ireland | 100.0 /100 | #19 | Exceptional 13.7% |
| Immigrants | Japan | 100.0 /100 | #20 | Exceptional 13.8% |
| Bolivians | 100.0 /100 | #21 | Exceptional 13.8% |
| Immigrants | Bolivia | 100.0 /100 | #22 | Exceptional 13.8% |
| Bulgarians | 99.9 /100 | #23 | Exceptional 13.9% |
| Asians | 99.9 /100 | #24 | Exceptional 14.0% |
| Cypriots | 99.9 /100 | #25 | Exceptional 14.0% |
| Immigrants | Lithuania | 99.9 /100 | #26 | Exceptional 14.1% |
| Tongans | 99.9 /100 | #27 | Exceptional 14.2% |
| Immigrants | Indonesia | 99.8 /100 | #28 | Exceptional 14.3% |
| Immigrants | Asia | 99.8 /100 | #29 | Exceptional 14.4% |
| Cambodians | 99.8 /100 | #30 | Exceptional 14.4% |
| Koreans | 99.8 /100 | #31 | Exceptional 14.4% |
| Immigrants | Sri Lanka | 99.8 /100 | #32 | Exceptional 14.4% |
| Taiwanese | 99.8 /100 | #33 | Exceptional 14.5% |