Immigrants from Costa Rica vs Immigrants from Lithuania Child Poverty Under the Age of 5
COMPARE
Immigrants from Costa Rica
Immigrants from Lithuania
Child Poverty Under the Age of 5
Child Poverty Under the Age of 5 Comparison
Immigrants from Costa Rica
Immigrants from Lithuania
17.4%
CHILD POVERTY UNDER THE AGE OF 5
39.0/ 100
METRIC RATING
184th/ 347
METRIC RANK
14.1%
CHILD POVERTY UNDER THE AGE OF 5
99.9/ 100
METRIC RATING
26th/ 347
METRIC RANK
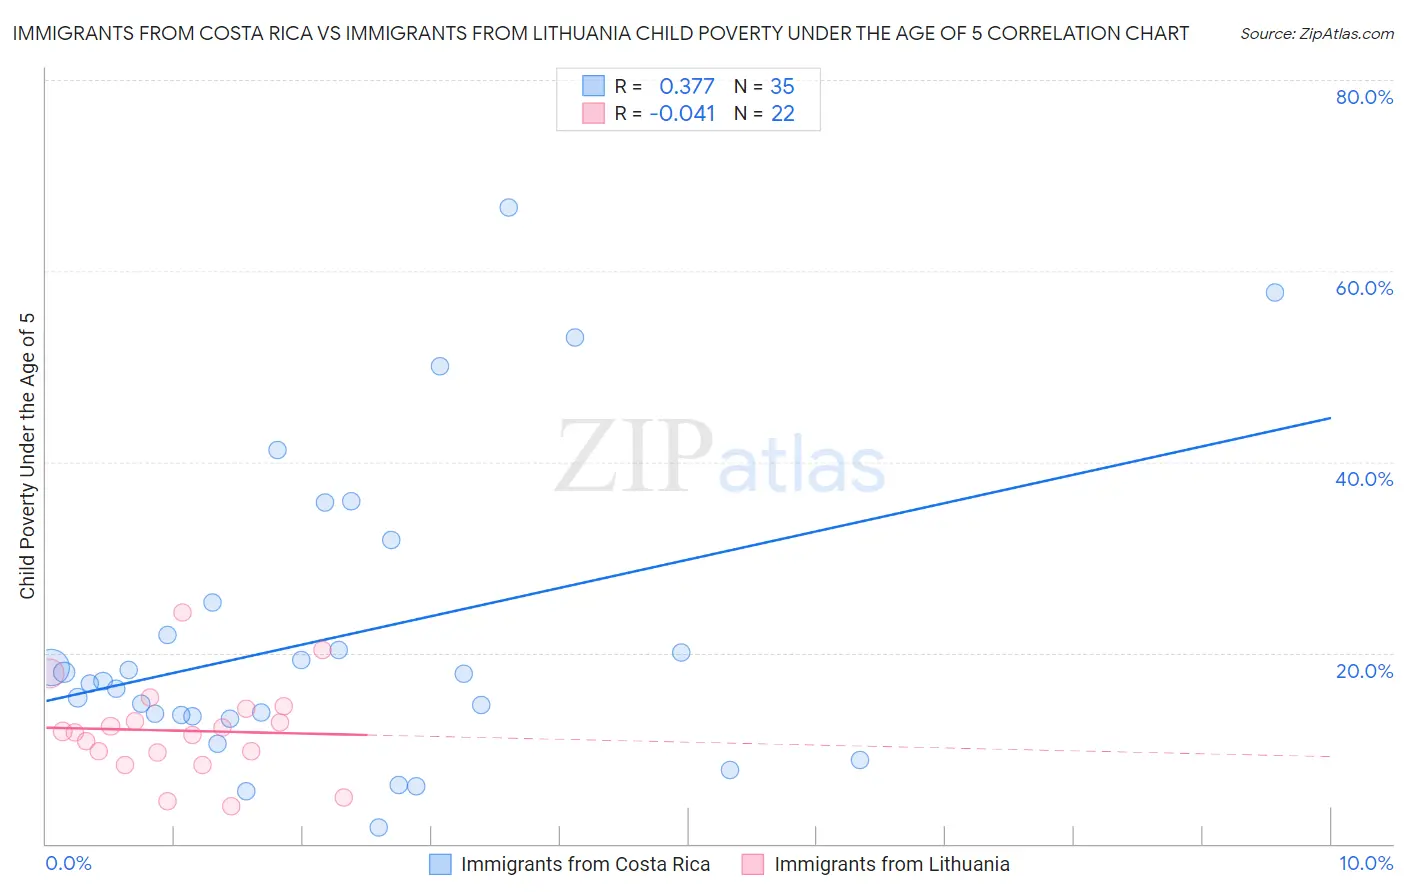
Immigrants from Costa Rica vs Immigrants from Lithuania Child Poverty Under the Age of 5 Correlation Chart
The statistical analysis conducted on geographies consisting of 200,253,710 people shows a mild positive correlation between the proportion of Immigrants from Costa Rica and poverty level among children under the age of 5 in the United States with a correlation coefficient (R) of 0.377 and weighted average of 17.4%. Similarly, the statistical analysis conducted on geographies consisting of 114,250,981 people shows no correlation between the proportion of Immigrants from Lithuania and poverty level among children under the age of 5 in the United States with a correlation coefficient (R) of -0.041 and weighted average of 14.1%, a difference of 23.7%.
Child Poverty Under the Age of 5 Correlation Summary
| Measurement | Immigrants from Costa Rica | Immigrants from Lithuania |
| Minimum | 1.7% | 3.9% |
| Maximum | 66.7% | 24.3% |
| Range | 65.0% | 20.4% |
| Mean | 21.7% | 11.8% |
| Median | 17.1% | 11.7% |
| Interquartile 25% (IQ1) | 13.3% | 9.6% |
| Interquartile 75% (IQ3) | 25.2% | 14.1% |
| Interquartile Range (IQR) | 11.9% | 4.5% |
| Standard Deviation (Sample) | 15.6% | 4.9% |
| Standard Deviation (Population) | 15.4% | 4.8% |
Similar Demographics by Child Poverty Under the Age of 5
Demographics Similar to Immigrants from Costa Rica by Child Poverty Under the Age of 5
In terms of child poverty under the age of 5, the demographic groups most similar to Immigrants from Costa Rica are Immigrants from Armenia (17.5%, a difference of 0.11%), Lebanese (17.4%, a difference of 0.14%), Arab (17.4%, a difference of 0.18%), Immigrants from Germany (17.4%, a difference of 0.21%), and South American Indian (17.4%, a difference of 0.25%).
| Demographics | Rating | Rank | Child Poverty Under the Age of 5 |
| Immigrants | Sierra Leone | 43.6 /100 | #177 | Average 17.3% |
| Immigrants | Cameroon | 42.7 /100 | #178 | Average 17.4% |
| Hawaiians | 41.5 /100 | #179 | Average 17.4% |
| South American Indians | 41.4 /100 | #180 | Average 17.4% |
| Immigrants | Germany | 41.0 /100 | #181 | Average 17.4% |
| Arabs | 40.7 /100 | #182 | Average 17.4% |
| Lebanese | 40.3 /100 | #183 | Average 17.4% |
| Immigrants | Costa Rica | 39.0 /100 | #184 | Fair 17.4% |
| Immigrants | Armenia | 38.0 /100 | #185 | Fair 17.5% |
| Immigrants | Bosnia and Herzegovina | 35.0 /100 | #186 | Fair 17.5% |
| Kenyans | 34.7 /100 | #187 | Fair 17.5% |
| Carpatho Rusyns | 33.6 /100 | #188 | Fair 17.5% |
| French | 33.6 /100 | #189 | Fair 17.5% |
| Slovaks | 29.2 /100 | #190 | Fair 17.6% |
| Immigrants | Afghanistan | 27.9 /100 | #191 | Fair 17.7% |
Demographics Similar to Immigrants from Lithuania by Child Poverty Under the Age of 5
In terms of child poverty under the age of 5, the demographic groups most similar to Immigrants from Lithuania are Tongan (14.2%, a difference of 0.49%), Asian (14.0%, a difference of 0.93%), Cypriot (14.0%, a difference of 0.93%), Bulgarian (13.9%, a difference of 1.5%), and Immigrants from Indonesia (14.3%, a difference of 1.7%).
| Demographics | Rating | Rank | Child Poverty Under the Age of 5 |
| Immigrants | Ireland | 100.0 /100 | #19 | Exceptional 13.7% |
| Immigrants | Japan | 100.0 /100 | #20 | Exceptional 13.8% |
| Bolivians | 100.0 /100 | #21 | Exceptional 13.8% |
| Immigrants | Bolivia | 100.0 /100 | #22 | Exceptional 13.8% |
| Bulgarians | 99.9 /100 | #23 | Exceptional 13.9% |
| Asians | 99.9 /100 | #24 | Exceptional 14.0% |
| Cypriots | 99.9 /100 | #25 | Exceptional 14.0% |
| Immigrants | Lithuania | 99.9 /100 | #26 | Exceptional 14.1% |
| Tongans | 99.9 /100 | #27 | Exceptional 14.2% |
| Immigrants | Indonesia | 99.8 /100 | #28 | Exceptional 14.3% |
| Immigrants | Asia | 99.8 /100 | #29 | Exceptional 14.4% |
| Cambodians | 99.8 /100 | #30 | Exceptional 14.4% |
| Koreans | 99.8 /100 | #31 | Exceptional 14.4% |
| Immigrants | Sri Lanka | 99.8 /100 | #32 | Exceptional 14.4% |
| Taiwanese | 99.8 /100 | #33 | Exceptional 14.5% |