Native Hawaiian vs Bahamian Child Poverty Under the Age of 5
COMPARE
Native Hawaiian
Bahamian
Child Poverty Under the Age of 5
Child Poverty Under the Age of 5 Comparison
Native Hawaiians
Bahamians
16.2%
CHILD POVERTY UNDER THE AGE OF 5
91.8/ 100
METRIC RATING
125th/ 347
METRIC RANK
23.0%
CHILD POVERTY UNDER THE AGE OF 5
0.0/ 100
METRIC RATING
313th/ 347
METRIC RANK
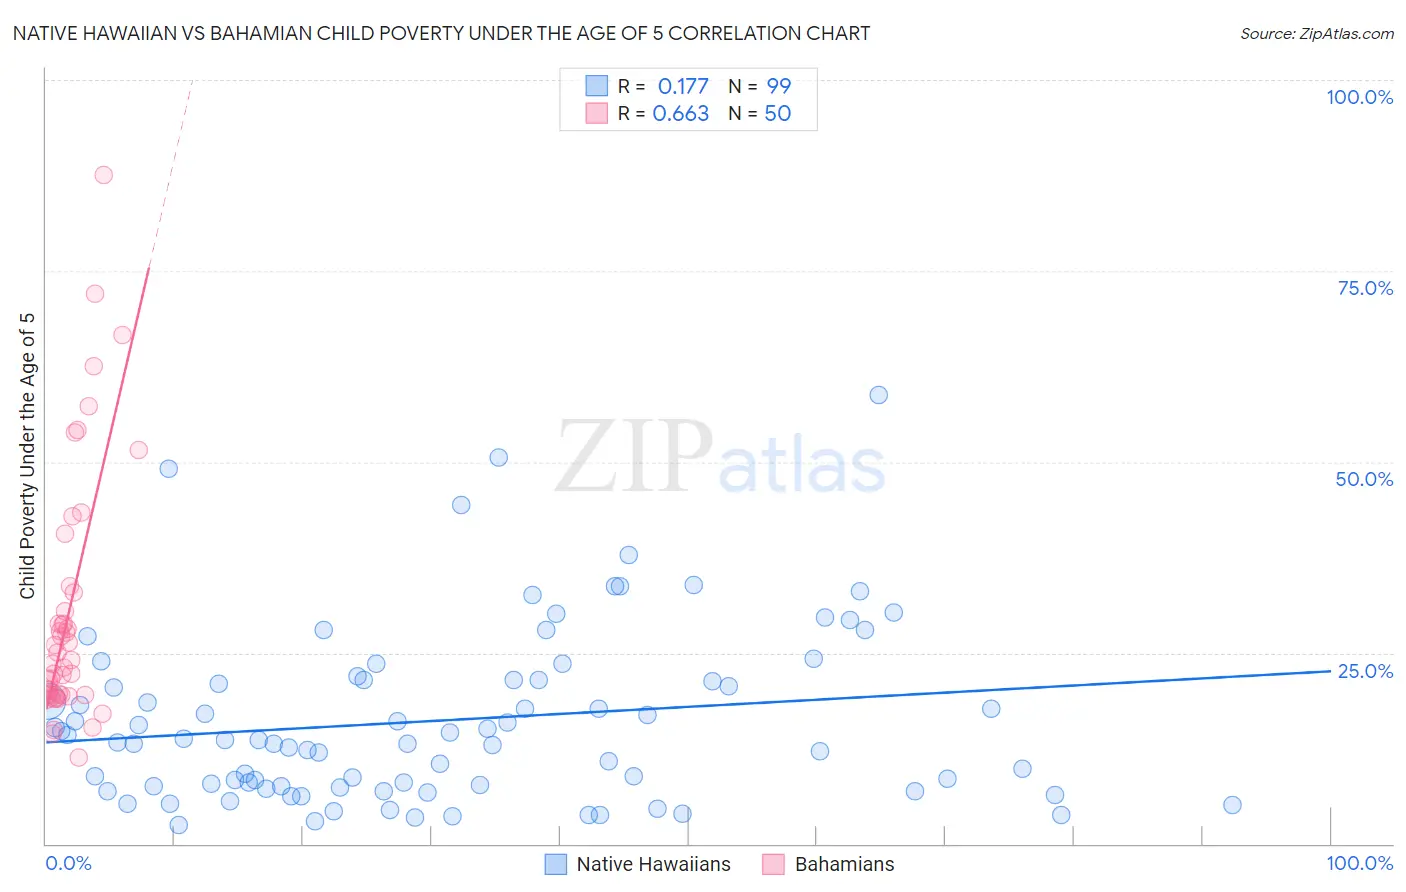
Native Hawaiian vs Bahamian Child Poverty Under the Age of 5 Correlation Chart
The statistical analysis conducted on geographies consisting of 323,152,225 people shows a poor positive correlation between the proportion of Native Hawaiians and poverty level among children under the age of 5 in the United States with a correlation coefficient (R) of 0.177 and weighted average of 16.2%. Similarly, the statistical analysis conducted on geographies consisting of 111,326,474 people shows a significant positive correlation between the proportion of Bahamians and poverty level among children under the age of 5 in the United States with a correlation coefficient (R) of 0.663 and weighted average of 23.0%, a difference of 42.2%.
Child Poverty Under the Age of 5 Correlation Summary
| Measurement | Native Hawaiian | Bahamian |
| Minimum | 2.4% | 11.3% |
| Maximum | 58.8% | 87.5% |
| Range | 56.4% | 76.2% |
| Mean | 16.1% | 30.2% |
| Median | 13.5% | 23.8% |
| Interquartile 25% (IQ1) | 7.5% | 19.5% |
| Interquartile 75% (IQ3) | 21.4% | 32.9% |
| Interquartile Range (IQR) | 13.9% | 13.4% |
| Standard Deviation (Sample) | 11.3% | 16.6% |
| Standard Deviation (Population) | 11.3% | 16.4% |
Similar Demographics by Child Poverty Under the Age of 5
Demographics Similar to Native Hawaiians by Child Poverty Under the Age of 5
In terms of child poverty under the age of 5, the demographic groups most similar to Native Hawaiians are Immigrants from Albania (16.2%, a difference of 0.0%), Swiss (16.1%, a difference of 0.070%), Austrian (16.1%, a difference of 0.080%), Immigrants from England (16.2%, a difference of 0.090%), and Immigrants from Southern Europe (16.1%, a difference of 0.10%).
| Demographics | Rating | Rank | Child Poverty Under the Age of 5 |
| Immigrants | Denmark | 93.4 /100 | #118 | Exceptional 16.0% |
| Immigrants | Jordan | 93.2 /100 | #119 | Exceptional 16.1% |
| Immigrants | Peru | 92.6 /100 | #120 | Exceptional 16.1% |
| Mongolians | 92.5 /100 | #121 | Exceptional 16.1% |
| Immigrants | Southern Europe | 92.0 /100 | #122 | Exceptional 16.1% |
| Austrians | 92.0 /100 | #123 | Exceptional 16.1% |
| Swiss | 92.0 /100 | #124 | Exceptional 16.1% |
| Native Hawaiians | 91.8 /100 | #125 | Exceptional 16.2% |
| Immigrants | Albania | 91.8 /100 | #126 | Exceptional 16.2% |
| Immigrants | England | 91.5 /100 | #127 | Exceptional 16.2% |
| South Africans | 90.1 /100 | #128 | Exceptional 16.2% |
| British | 89.4 /100 | #129 | Excellent 16.3% |
| Immigrants | Norway | 89.3 /100 | #130 | Excellent 16.3% |
| Finns | 88.3 /100 | #131 | Excellent 16.3% |
| Serbians | 88.2 /100 | #132 | Excellent 16.3% |
Demographics Similar to Bahamians by Child Poverty Under the Age of 5
In terms of child poverty under the age of 5, the demographic groups most similar to Bahamians are Honduran (23.0%, a difference of 0.050%), U.S. Virgin Islander (23.0%, a difference of 0.090%), Seminole (22.8%, a difference of 0.65%), Arapaho (23.1%, a difference of 0.65%), and African (22.8%, a difference of 0.69%).
| Demographics | Rating | Rank | Child Poverty Under the Age of 5 |
| Indonesians | 0.0 /100 | #306 | Tragic 22.3% |
| Immigrants | Bahamas | 0.0 /100 | #307 | Tragic 22.7% |
| Immigrants | Dominica | 0.0 /100 | #308 | Tragic 22.7% |
| Houma | 0.0 /100 | #309 | Tragic 22.7% |
| Africans | 0.0 /100 | #310 | Tragic 22.8% |
| Seminole | 0.0 /100 | #311 | Tragic 22.8% |
| Hondurans | 0.0 /100 | #312 | Tragic 23.0% |
| Bahamians | 0.0 /100 | #313 | Tragic 23.0% |
| U.S. Virgin Islanders | 0.0 /100 | #314 | Tragic 23.0% |
| Arapaho | 0.0 /100 | #315 | Tragic 23.1% |
| Yakama | 0.0 /100 | #316 | Tragic 23.1% |
| Menominee | 0.0 /100 | #317 | Tragic 23.3% |
| Dutch West Indians | 0.0 /100 | #318 | Tragic 23.3% |
| Chippewa | 0.0 /100 | #319 | Tragic 23.4% |
| Choctaw | 0.0 /100 | #320 | Tragic 23.5% |