Immigrants from Russia vs Immigrants from Iran Poverty
COMPARE
Immigrants from Russia
Immigrants from Iran
Poverty
Poverty Comparison
Immigrants from Russia
Immigrants from Iran
11.7%
POVERTY
89.7/ 100
METRIC RATING
116th/ 347
METRIC RANK
10.9%
POVERTY
99.2/ 100
METRIC RATING
41st/ 347
METRIC RANK
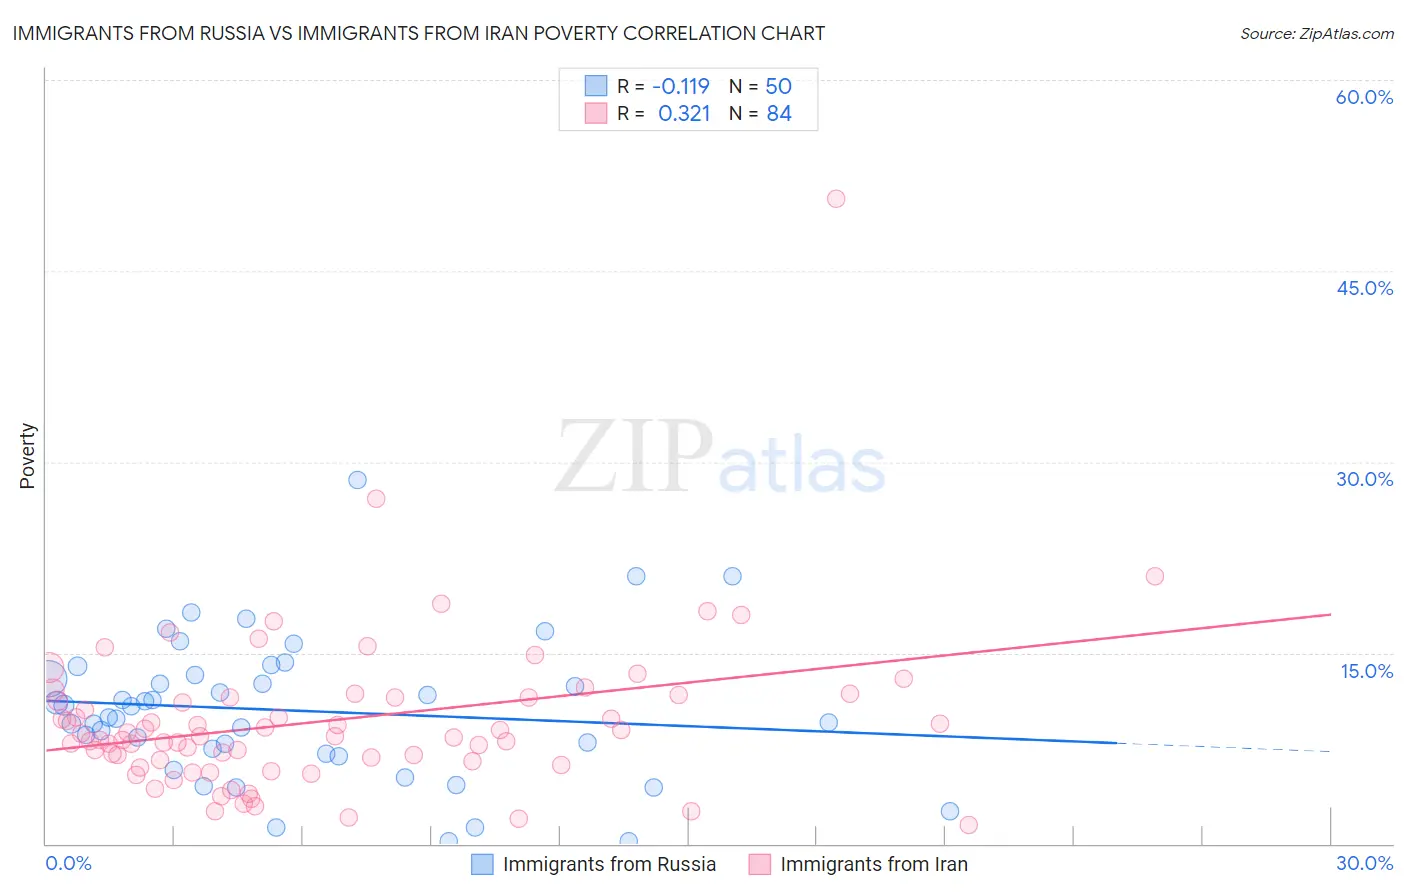
Immigrants from Russia vs Immigrants from Iran Poverty Correlation Chart
The statistical analysis conducted on geographies consisting of 347,709,239 people shows a poor negative correlation between the proportion of Immigrants from Russia and poverty level in the United States with a correlation coefficient (R) of -0.119 and weighted average of 11.7%. Similarly, the statistical analysis conducted on geographies consisting of 279,844,732 people shows a mild positive correlation between the proportion of Immigrants from Iran and poverty level in the United States with a correlation coefficient (R) of 0.321 and weighted average of 10.9%, a difference of 7.5%.
Poverty Correlation Summary
| Measurement | Immigrants from Russia | Immigrants from Iran |
| Minimum | 0.17% | 1.5% |
| Maximum | 28.6% | 50.6% |
| Range | 28.4% | 49.1% |
| Mean | 10.4% | 9.7% |
| Median | 10.4% | 8.4% |
| Interquartile 25% (IQ1) | 7.1% | 6.5% |
| Interquartile 75% (IQ3) | 13.3% | 11.5% |
| Interquartile Range (IQR) | 6.2% | 5.0% |
| Standard Deviation (Sample) | 5.7% | 6.4% |
| Standard Deviation (Population) | 5.6% | 6.4% |
Similar Demographics by Poverty
Demographics Similar to Immigrants from Russia by Poverty
In terms of poverty, the demographic groups most similar to Immigrants from Russia are Sri Lankan (11.7%, a difference of 0.070%), Argentinean (11.7%, a difference of 0.15%), Albanian (11.7%, a difference of 0.17%), Tlingit-Haida (11.7%, a difference of 0.19%), and Immigrants from South Eastern Asia (11.7%, a difference of 0.20%).
| Demographics | Rating | Rank | Poverty |
| Immigrants | Turkey | 91.7 /100 | #109 | Exceptional 11.6% |
| Welsh | 91.6 /100 | #110 | Exceptional 11.6% |
| French Canadians | 91.0 /100 | #111 | Exceptional 11.6% |
| Immigrants | Southern Europe | 90.8 /100 | #112 | Exceptional 11.6% |
| Immigrants | Belarus | 90.8 /100 | #113 | Exceptional 11.6% |
| Immigrants | China | 90.7 /100 | #114 | Exceptional 11.6% |
| Albanians | 90.3 /100 | #115 | Exceptional 11.7% |
| Immigrants | Russia | 89.7 /100 | #116 | Excellent 11.7% |
| Sri Lankans | 89.4 /100 | #117 | Excellent 11.7% |
| Argentineans | 89.1 /100 | #118 | Excellent 11.7% |
| Tlingit-Haida | 89.0 /100 | #119 | Excellent 11.7% |
| Immigrants | South Eastern Asia | 88.9 /100 | #120 | Excellent 11.7% |
| New Zealanders | 88.7 /100 | #121 | Excellent 11.7% |
| Puget Sound Salish | 88.7 /100 | #122 | Excellent 11.7% |
| Immigrants | Hungary | 88.6 /100 | #123 | Excellent 11.7% |
Demographics Similar to Immigrants from Iran by Poverty
In terms of poverty, the demographic groups most similar to Immigrants from Iran are Russian (10.9%, a difference of 0.090%), Immigrants from Pakistan (10.8%, a difference of 0.14%), Czech (10.8%, a difference of 0.22%), Korean (10.9%, a difference of 0.22%), and Immigrants from Greece (10.8%, a difference of 0.26%).
| Demographics | Rating | Rank | Poverty |
| Immigrants | Poland | 99.4 /100 | #34 | Exceptional 10.8% |
| Tongans | 99.4 /100 | #35 | Exceptional 10.8% |
| Cypriots | 99.3 /100 | #36 | Exceptional 10.8% |
| Immigrants | Greece | 99.3 /100 | #37 | Exceptional 10.8% |
| Czechs | 99.3 /100 | #38 | Exceptional 10.8% |
| Immigrants | Pakistan | 99.3 /100 | #39 | Exceptional 10.8% |
| Russians | 99.3 /100 | #40 | Exceptional 10.9% |
| Immigrants | Iran | 99.2 /100 | #41 | Exceptional 10.9% |
| Koreans | 99.2 /100 | #42 | Exceptional 10.9% |
| Immigrants | Singapore | 99.2 /100 | #43 | Exceptional 10.9% |
| Immigrants | Moldova | 99.1 /100 | #44 | Exceptional 10.9% |
| Turks | 98.9 /100 | #45 | Exceptional 11.0% |
| Immigrants | Czechoslovakia | 98.9 /100 | #46 | Exceptional 11.0% |
| Immigrants | Romania | 98.9 /100 | #47 | Exceptional 11.0% |
| Slovenes | 98.9 /100 | #48 | Exceptional 11.0% |