Moroccan vs Immigrants from Uganda 12th Grade, No Diploma
COMPARE
Moroccan
Immigrants from Uganda
12th Grade, No Diploma
12th Grade, No Diploma Comparison
Moroccans
Immigrants from Uganda
90.9%
12TH GRADE, NO DIPLOMA
28.8/ 100
METRIC RATING
191st/ 347
METRIC RANK
90.9%
12TH GRADE, NO DIPLOMA
31.6/ 100
METRIC RATING
189th/ 347
METRIC RANK
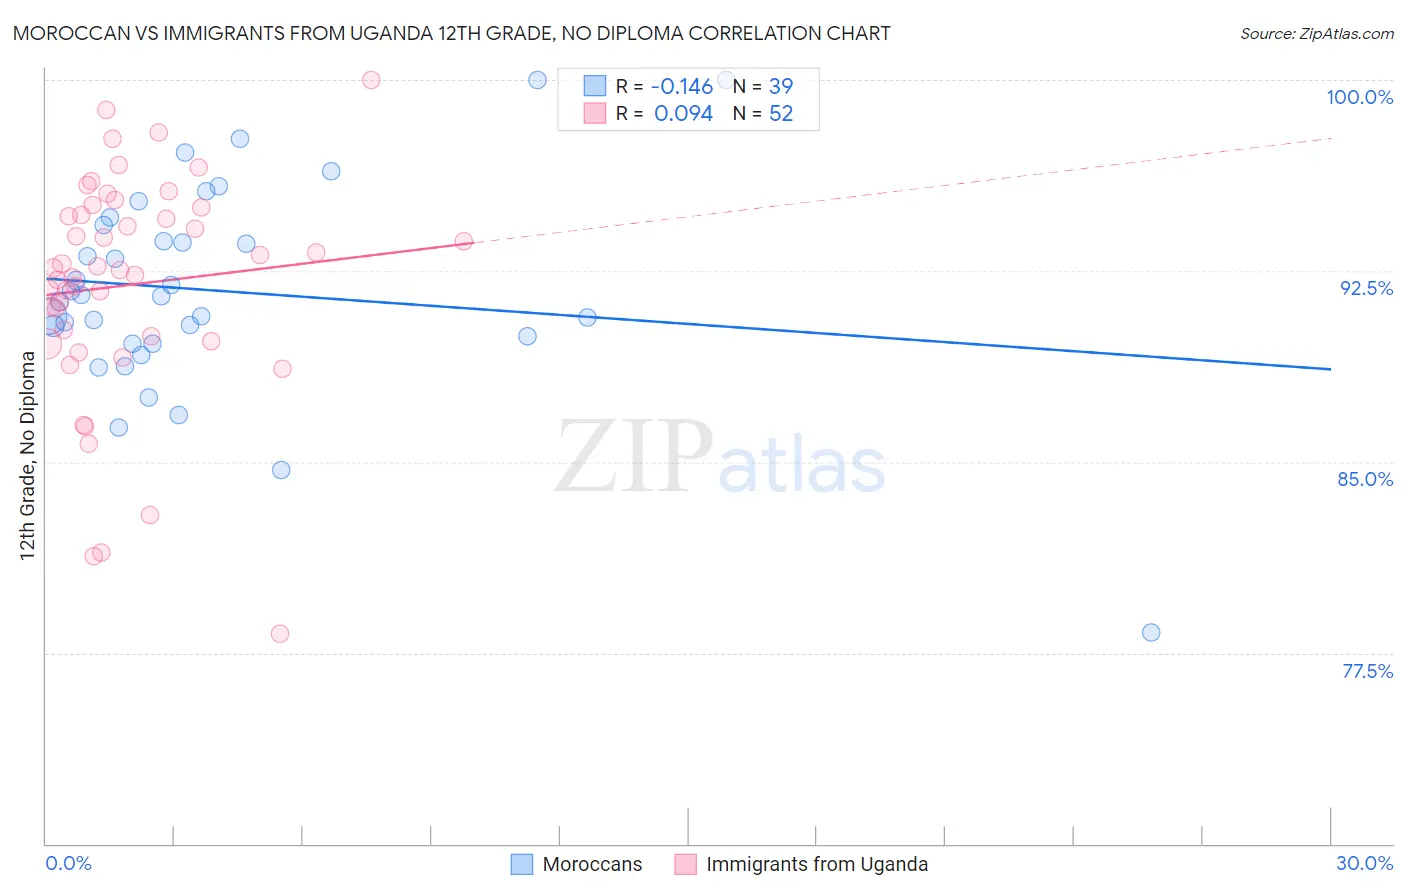
Moroccan vs Immigrants from Uganda 12th Grade, No Diploma Correlation Chart
The statistical analysis conducted on geographies consisting of 201,817,667 people shows a poor negative correlation between the proportion of Moroccans and percentage of population with at least 12th grade (no diploma) education in the United States with a correlation coefficient (R) of -0.146 and weighted average of 90.9%. Similarly, the statistical analysis conducted on geographies consisting of 125,969,169 people shows a slight positive correlation between the proportion of Immigrants from Uganda and percentage of population with at least 12th grade (no diploma) education in the United States with a correlation coefficient (R) of 0.094 and weighted average of 90.9%, a difference of 0.040%.
12th Grade, No Diploma Correlation Summary
| Measurement | Moroccan | Immigrants from Uganda |
| Minimum | 78.3% | 78.2% |
| Maximum | 100.0% | 100.0% |
| Range | 21.7% | 21.8% |
| Mean | 91.7% | 92.0% |
| Median | 91.5% | 92.6% |
| Interquartile 25% (IQ1) | 89.7% | 89.9% |
| Interquartile 75% (IQ3) | 94.3% | 94.9% |
| Interquartile Range (IQR) | 4.6% | 5.0% |
| Standard Deviation (Sample) | 4.1% | 4.4% |
| Standard Deviation (Population) | 4.1% | 4.4% |
Demographics Similar to Moroccans and Immigrants from Uganda by 12th Grade, No Diploma
In terms of 12th grade, no diploma, the demographic groups most similar to Moroccans are Afghan (90.9%, a difference of 0.010%), Immigrants from Eastern Africa (90.9%, a difference of 0.020%), Immigrants from Ethiopia (90.9%, a difference of 0.030%), Immigrants from Oceania (90.9%, a difference of 0.040%), and American (91.0%, a difference of 0.050%). Similarly, the demographic groups most similar to Immigrants from Uganda are American (91.0%, a difference of 0.010%), Potawatomi (91.0%, a difference of 0.020%), Ethiopian (91.0%, a difference of 0.030%), Afghan (90.9%, a difference of 0.030%), and Sudanese (91.0%, a difference of 0.040%).
| Demographics | Rating | Rank | 12th Grade, No Diploma |
| Immigrants | Syria | 40.3 /100 | #180 | Average 91.1% |
| Guamanians/Chamorros | 39.5 /100 | #181 | Fair 91.0% |
| Immigrants | Nonimmigrants | 38.8 /100 | #182 | Fair 91.0% |
| Osage | 38.3 /100 | #183 | Fair 91.0% |
| Spaniards | 36.2 /100 | #184 | Fair 91.0% |
| Sudanese | 34.4 /100 | #185 | Fair 91.0% |
| Ethiopians | 33.9 /100 | #186 | Fair 91.0% |
| Potawatomi | 32.9 /100 | #187 | Fair 91.0% |
| Americans | 32.6 /100 | #188 | Fair 91.0% |
| Immigrants | Uganda | 31.6 /100 | #189 | Fair 90.9% |
| Afghans | 29.9 /100 | #190 | Fair 90.9% |
| Moroccans | 28.8 /100 | #191 | Fair 90.9% |
| Immigrants | Eastern Africa | 27.7 /100 | #192 | Fair 90.9% |
| Immigrants | Ethiopia | 27.2 /100 | #193 | Fair 90.9% |
| Immigrants | Oceania | 26.0 /100 | #194 | Fair 90.9% |
| Koreans | 24.5 /100 | #195 | Fair 90.8% |
| Panamanians | 22.8 /100 | #196 | Fair 90.8% |
| Immigrants | Sudan | 22.6 /100 | #197 | Fair 90.8% |
| Samoans | 20.4 /100 | #198 | Fair 90.8% |
| Immigrants | Southern Europe | 19.9 /100 | #199 | Poor 90.8% |
| Liberians | 19.8 /100 | #200 | Poor 90.8% |