Moroccan vs Immigrants from Poland 3rd Grade
COMPARE
Moroccan
Immigrants from Poland
3rd Grade
3rd Grade Comparison
Moroccans
Immigrants from Poland
97.6%
3RD GRADE
8.5/ 100
METRIC RATING
213th/ 347
METRIC RANK
97.8%
3RD GRADE
47.1/ 100
METRIC RATING
176th/ 347
METRIC RANK
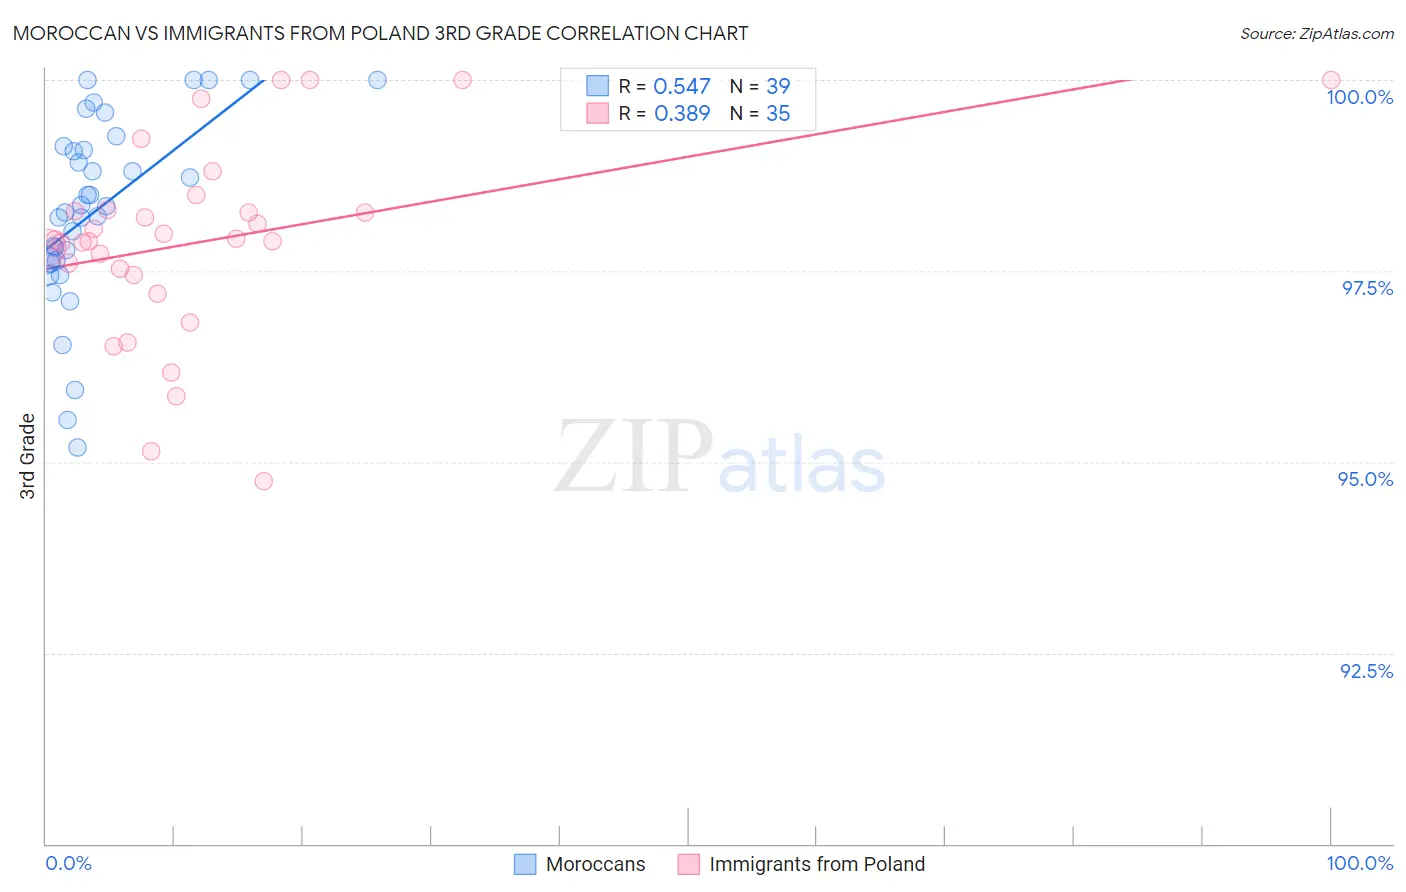
Moroccan vs Immigrants from Poland 3rd Grade Correlation Chart
The statistical analysis conducted on geographies consisting of 201,817,667 people shows a substantial positive correlation between the proportion of Moroccans and percentage of population with at least 3rd grade education in the United States with a correlation coefficient (R) of 0.547 and weighted average of 97.6%. Similarly, the statistical analysis conducted on geographies consisting of 304,861,559 people shows a mild positive correlation between the proportion of Immigrants from Poland and percentage of population with at least 3rd grade education in the United States with a correlation coefficient (R) of 0.389 and weighted average of 97.8%, a difference of 0.19%.
3rd Grade Correlation Summary
| Measurement | Moroccan | Immigrants from Poland |
| Minimum | 95.2% | 94.8% |
| Maximum | 100.0% | 100.0% |
| Range | 4.8% | 5.2% |
| Mean | 98.3% | 97.9% |
| Median | 98.3% | 97.9% |
| Interquartile 25% (IQ1) | 97.6% | 97.4% |
| Interquartile 75% (IQ3) | 99.1% | 98.3% |
| Interquartile Range (IQR) | 1.5% | 0.86% |
| Standard Deviation (Sample) | 1.2% | 1.3% |
| Standard Deviation (Population) | 1.2% | 1.3% |
Similar Demographics by 3rd Grade
Demographics Similar to Moroccans by 3rd Grade
In terms of 3rd grade, the demographic groups most similar to Moroccans are Immigrants from Bahamas (97.6%, a difference of 0.0%), Yuman (97.6%, a difference of 0.0%), Costa Rican (97.6%, a difference of 0.010%), Immigrants from Oceania (97.6%, a difference of 0.010%), and Laotian (97.6%, a difference of 0.010%).
| Demographics | Rating | Rank | 3rd Grade |
| Immigrants | Northern Africa | 13.0 /100 | #206 | Poor 97.6% |
| Tohono O'odham | 12.5 /100 | #207 | Poor 97.6% |
| Immigrants | Zaire | 11.9 /100 | #208 | Poor 97.6% |
| Costa Ricans | 9.6 /100 | #209 | Tragic 97.6% |
| Immigrants | Oceania | 9.5 /100 | #210 | Tragic 97.6% |
| Laotians | 9.4 /100 | #211 | Tragic 97.6% |
| Immigrants | Bahamas | 8.5 /100 | #212 | Tragic 97.6% |
| Moroccans | 8.5 /100 | #213 | Tragic 97.6% |
| Yuman | 8.4 /100 | #214 | Tragic 97.6% |
| Iraqis | 6.9 /100 | #215 | Tragic 97.5% |
| Samoans | 6.9 /100 | #216 | Tragic 97.5% |
| South American Indians | 5.7 /100 | #217 | Tragic 97.5% |
| Immigrants | Nepal | 5.3 /100 | #218 | Tragic 97.5% |
| Immigrants | Panama | 5.2 /100 | #219 | Tragic 97.5% |
| Immigrants | Morocco | 5.0 /100 | #220 | Tragic 97.5% |
Demographics Similar to Immigrants from Poland by 3rd Grade
In terms of 3rd grade, the demographic groups most similar to Immigrants from Poland are Immigrants from Micronesia (97.8%, a difference of 0.0%), Egyptian (97.7%, a difference of 0.0%), Immigrants from Brazil (97.7%, a difference of 0.0%), Immigrants from Belarus (97.7%, a difference of 0.0%), and Immigrants from Korea (97.8%, a difference of 0.010%).
| Demographics | Rating | Rank | 3rd Grade |
| Comanche | 53.8 /100 | #169 | Average 97.8% |
| Brazilians | 53.7 /100 | #170 | Average 97.8% |
| Kenyans | 51.8 /100 | #171 | Average 97.8% |
| Spanish Americans | 51.8 /100 | #172 | Average 97.8% |
| Immigrants | Korea | 50.9 /100 | #173 | Average 97.8% |
| Navajo | 50.0 /100 | #174 | Average 97.8% |
| Immigrants | Micronesia | 47.6 /100 | #175 | Average 97.8% |
| Immigrants | Poland | 47.1 /100 | #176 | Average 97.8% |
| Egyptians | 46.6 /100 | #177 | Average 97.7% |
| Immigrants | Brazil | 46.4 /100 | #178 | Average 97.7% |
| Immigrants | Belarus | 45.9 /100 | #179 | Average 97.7% |
| Immigrants | Sri Lanka | 45.1 /100 | #180 | Average 97.7% |
| Immigrants | Venezuela | 44.4 /100 | #181 | Average 97.7% |
| Argentineans | 42.9 /100 | #182 | Average 97.7% |
| Arabs | 40.0 /100 | #183 | Fair 97.7% |