Mongolian vs Sudanese Poverty
COMPARE
Mongolian
Sudanese
Poverty
Poverty Comparison
Mongolians
Sudanese
12.4%
POVERTY
43.6/ 100
METRIC RATING
180th/ 347
METRIC RANK
14.0%
POVERTY
0.3/ 100
METRIC RATING
243rd/ 347
METRIC RANK
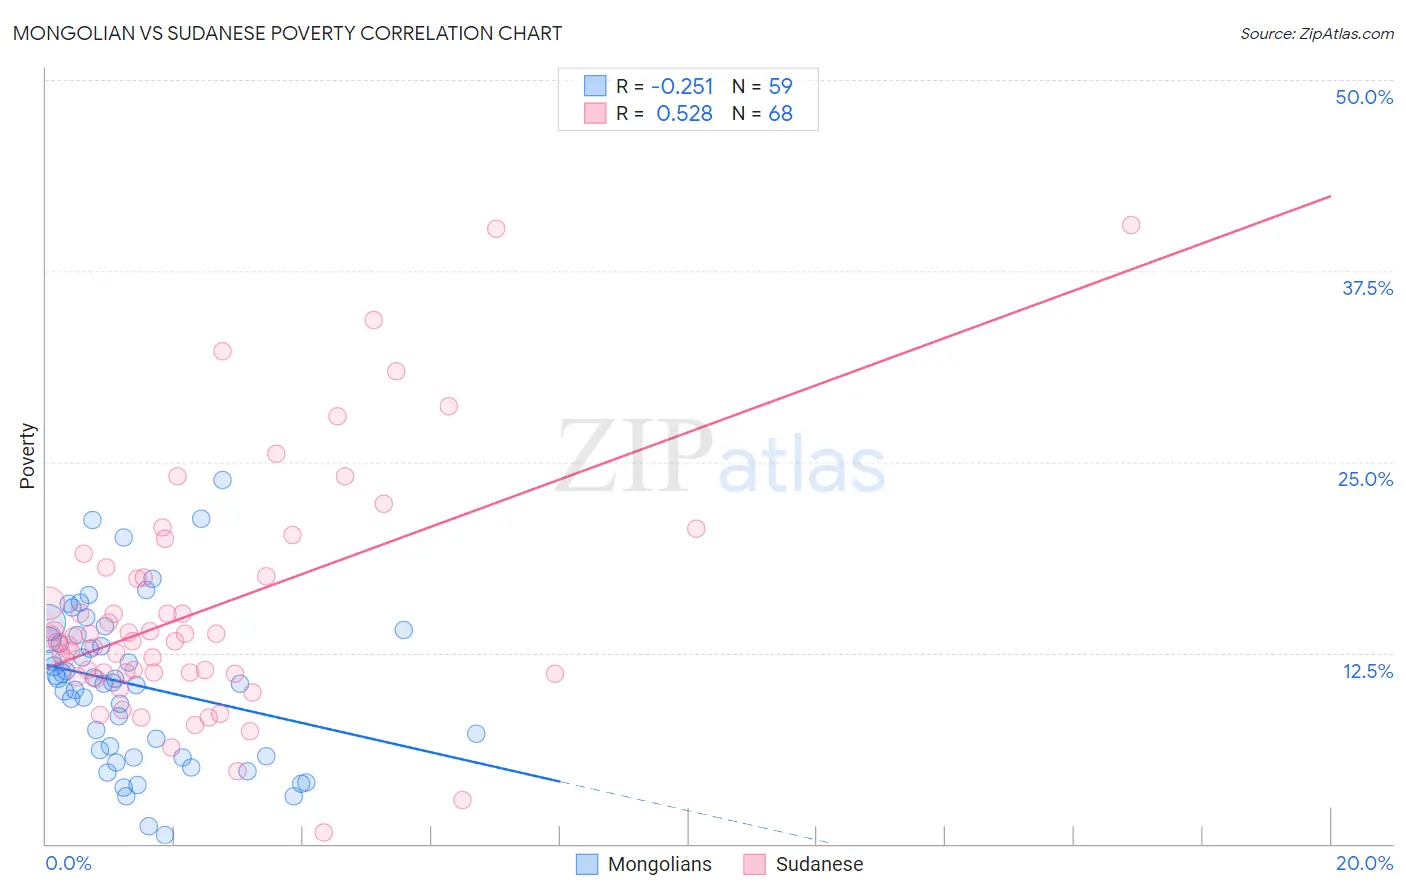
Mongolian vs Sudanese Poverty Correlation Chart
The statistical analysis conducted on geographies consisting of 140,290,240 people shows a weak negative correlation between the proportion of Mongolians and poverty level in the United States with a correlation coefficient (R) of -0.251 and weighted average of 12.4%. Similarly, the statistical analysis conducted on geographies consisting of 110,120,634 people shows a substantial positive correlation between the proportion of Sudanese and poverty level in the United States with a correlation coefficient (R) of 0.528 and weighted average of 14.0%, a difference of 13.1%.
Poverty Correlation Summary
| Measurement | Mongolian | Sudanese |
| Minimum | 0.57% | 0.75% |
| Maximum | 23.9% | 40.5% |
| Range | 23.3% | 39.8% |
| Mean | 10.4% | 15.4% |
| Median | 10.6% | 13.4% |
| Interquartile 25% (IQ1) | 5.7% | 11.2% |
| Interquartile 75% (IQ3) | 13.6% | 17.8% |
| Interquartile Range (IQR) | 7.9% | 6.6% |
| Standard Deviation (Sample) | 5.2% | 7.9% |
| Standard Deviation (Population) | 5.1% | 7.8% |
Similar Demographics by Poverty
Demographics Similar to Mongolians by Poverty
In terms of poverty, the demographic groups most similar to Mongolians are Immigrants from Morocco (12.4%, a difference of 0.040%), Uruguayan (12.4%, a difference of 0.10%), Immigrants from Afghanistan (12.4%, a difference of 0.15%), Immigrants from Cameroon (12.4%, a difference of 0.19%), and Immigrants from Iraq (12.4%, a difference of 0.34%).
| Demographics | Rating | Rank | Poverty |
| Celtics | 50.1 /100 | #173 | Average 12.3% |
| Lebanese | 50.0 /100 | #174 | Average 12.3% |
| South Americans | 48.7 /100 | #175 | Average 12.3% |
| Immigrants | Colombia | 47.7 /100 | #176 | Average 12.3% |
| Immigrants | Syria | 47.5 /100 | #177 | Average 12.3% |
| Uruguayans | 44.7 /100 | #178 | Average 12.4% |
| Immigrants | Morocco | 44.0 /100 | #179 | Average 12.4% |
| Mongolians | 43.6 /100 | #180 | Average 12.4% |
| Immigrants | Afghanistan | 42.1 /100 | #181 | Average 12.4% |
| Immigrants | Cameroon | 41.7 /100 | #182 | Average 12.4% |
| Immigrants | Iraq | 40.2 /100 | #183 | Average 12.4% |
| Kenyans | 38.8 /100 | #184 | Fair 12.5% |
| Israelis | 36.4 /100 | #185 | Fair 12.5% |
| Immigrants | Sierra Leone | 36.3 /100 | #186 | Fair 12.5% |
| Hawaiians | 34.1 /100 | #187 | Fair 12.5% |
Demographics Similar to Sudanese by Poverty
In terms of poverty, the demographic groups most similar to Sudanese are Nepalese (14.0%, a difference of 0.030%), Ecuadorian (14.0%, a difference of 0.070%), Salvadoran (14.0%, a difference of 0.39%), Immigrants from Middle Africa (14.0%, a difference of 0.41%), and Immigrants from Sudan (14.1%, a difference of 0.42%).
| Demographics | Rating | Rank | Poverty |
| Immigrants | Armenia | 0.5 /100 | #236 | Tragic 13.9% |
| French American Indians | 0.5 /100 | #237 | Tragic 13.9% |
| Ghanaians | 0.5 /100 | #238 | Tragic 13.9% |
| Nicaraguans | 0.4 /100 | #239 | Tragic 13.9% |
| Immigrants | Middle Africa | 0.4 /100 | #240 | Tragic 14.0% |
| Salvadorans | 0.4 /100 | #241 | Tragic 14.0% |
| Ecuadorians | 0.4 /100 | #242 | Tragic 14.0% |
| Sudanese | 0.3 /100 | #243 | Tragic 14.0% |
| Nepalese | 0.3 /100 | #244 | Tragic 14.0% |
| Immigrants | Sudan | 0.3 /100 | #245 | Tragic 14.1% |
| Potawatomi | 0.3 /100 | #246 | Tragic 14.1% |
| Liberians | 0.2 /100 | #247 | Tragic 14.1% |
| Immigrants | Western Africa | 0.2 /100 | #248 | Tragic 14.1% |
| Immigrants | Ghana | 0.2 /100 | #249 | Tragic 14.2% |
| Cree | 0.2 /100 | #250 | Tragic 14.2% |