Eastern European vs Sudanese Poverty
COMPARE
Eastern European
Sudanese
Poverty
Poverty Comparison
Eastern Europeans
Sudanese
10.6%
POVERTY
99.7/ 100
METRIC RATING
22nd/ 347
METRIC RANK
14.0%
POVERTY
0.3/ 100
METRIC RATING
243rd/ 347
METRIC RANK
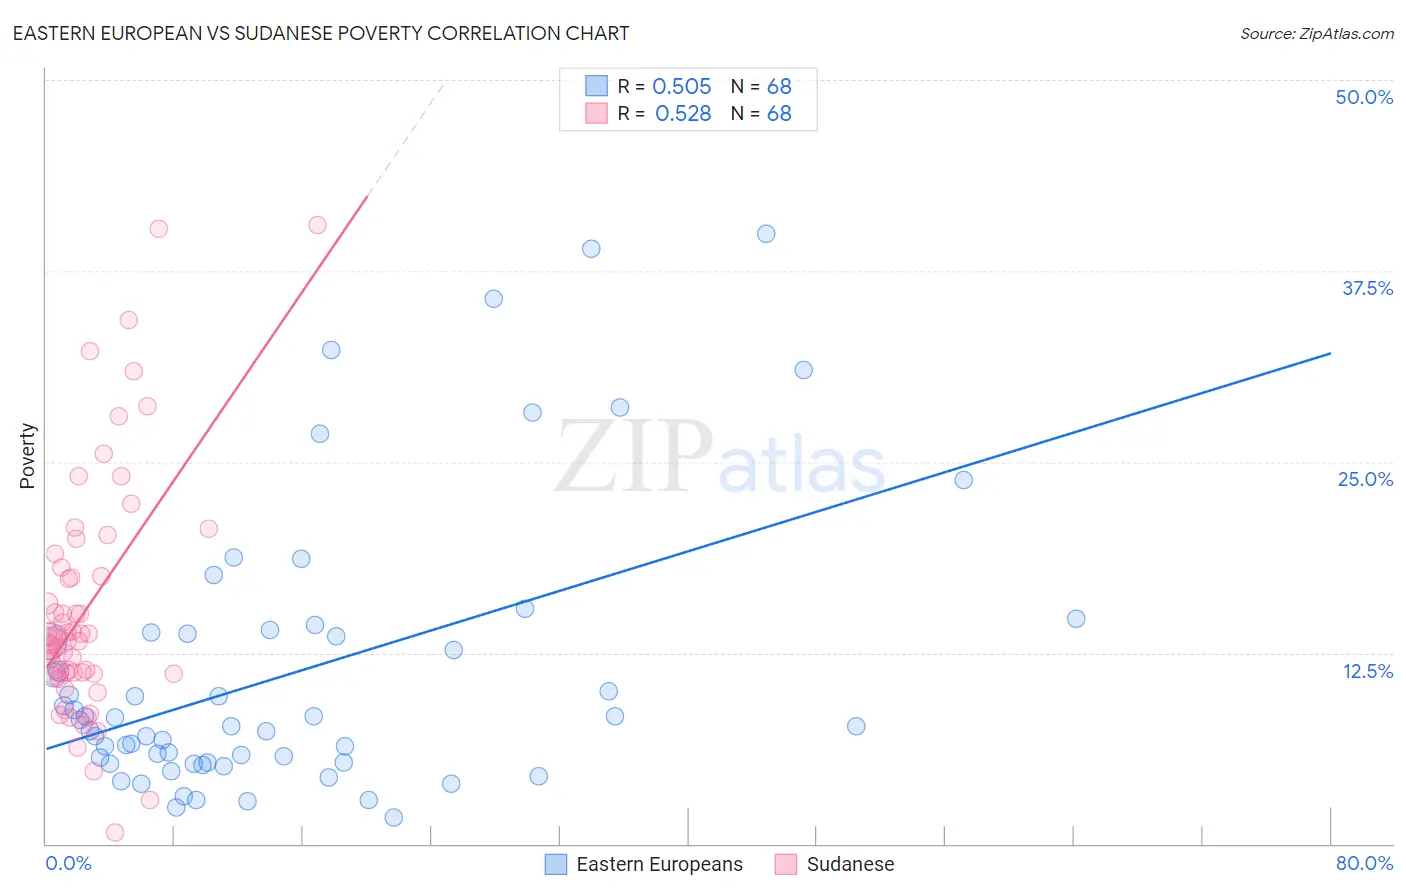
Eastern European vs Sudanese Poverty Correlation Chart
The statistical analysis conducted on geographies consisting of 460,932,283 people shows a substantial positive correlation between the proportion of Eastern Europeans and poverty level in the United States with a correlation coefficient (R) of 0.505 and weighted average of 10.6%. Similarly, the statistical analysis conducted on geographies consisting of 110,120,634 people shows a substantial positive correlation between the proportion of Sudanese and poverty level in the United States with a correlation coefficient (R) of 0.528 and weighted average of 14.0%, a difference of 32.2%.
Poverty Correlation Summary
| Measurement | Eastern European | Sudanese |
| Minimum | 1.7% | 0.75% |
| Maximum | 39.9% | 40.5% |
| Range | 38.2% | 39.8% |
| Mean | 11.2% | 15.4% |
| Median | 7.9% | 13.4% |
| Interquartile 25% (IQ1) | 5.3% | 11.2% |
| Interquartile 75% (IQ3) | 13.8% | 17.8% |
| Interquartile Range (IQR) | 8.4% | 6.6% |
| Standard Deviation (Sample) | 9.1% | 7.9% |
| Standard Deviation (Population) | 9.1% | 7.8% |
Similar Demographics by Poverty
Demographics Similar to Eastern Europeans by Poverty
In terms of poverty, the demographic groups most similar to Eastern Europeans are Swedish (10.6%, a difference of 0.11%), Italian (10.6%, a difference of 0.15%), Luxembourger (10.6%, a difference of 0.16%), Immigrants from North Macedonia (10.6%, a difference of 0.24%), and Immigrants from Scotland (10.6%, a difference of 0.35%).
| Demographics | Rating | Rank | Poverty |
| Bolivians | 99.8 /100 | #15 | Exceptional 10.4% |
| Lithuanians | 99.8 /100 | #16 | Exceptional 10.5% |
| Norwegians | 99.8 /100 | #17 | Exceptional 10.5% |
| Latvians | 99.8 /100 | #18 | Exceptional 10.5% |
| Immigrants | Scotland | 99.7 /100 | #19 | Exceptional 10.6% |
| Immigrants | North Macedonia | 99.7 /100 | #20 | Exceptional 10.6% |
| Luxembourgers | 99.7 /100 | #21 | Exceptional 10.6% |
| Eastern Europeans | 99.7 /100 | #22 | Exceptional 10.6% |
| Swedes | 99.7 /100 | #23 | Exceptional 10.6% |
| Italians | 99.7 /100 | #24 | Exceptional 10.6% |
| Croatians | 99.6 /100 | #25 | Exceptional 10.6% |
| Burmese | 99.6 /100 | #26 | Exceptional 10.7% |
| Immigrants | Northern Europe | 99.6 /100 | #27 | Exceptional 10.7% |
| Immigrants | Korea | 99.5 /100 | #28 | Exceptional 10.7% |
| Greeks | 99.5 /100 | #29 | Exceptional 10.7% |
Demographics Similar to Sudanese by Poverty
In terms of poverty, the demographic groups most similar to Sudanese are Nepalese (14.0%, a difference of 0.030%), Ecuadorian (14.0%, a difference of 0.070%), Salvadoran (14.0%, a difference of 0.39%), Immigrants from Middle Africa (14.0%, a difference of 0.41%), and Immigrants from Sudan (14.1%, a difference of 0.42%).
| Demographics | Rating | Rank | Poverty |
| Immigrants | Armenia | 0.5 /100 | #236 | Tragic 13.9% |
| French American Indians | 0.5 /100 | #237 | Tragic 13.9% |
| Ghanaians | 0.5 /100 | #238 | Tragic 13.9% |
| Nicaraguans | 0.4 /100 | #239 | Tragic 13.9% |
| Immigrants | Middle Africa | 0.4 /100 | #240 | Tragic 14.0% |
| Salvadorans | 0.4 /100 | #241 | Tragic 14.0% |
| Ecuadorians | 0.4 /100 | #242 | Tragic 14.0% |
| Sudanese | 0.3 /100 | #243 | Tragic 14.0% |
| Nepalese | 0.3 /100 | #244 | Tragic 14.0% |
| Immigrants | Sudan | 0.3 /100 | #245 | Tragic 14.1% |
| Potawatomi | 0.3 /100 | #246 | Tragic 14.1% |
| Liberians | 0.2 /100 | #247 | Tragic 14.1% |
| Immigrants | Western Africa | 0.2 /100 | #248 | Tragic 14.1% |
| Immigrants | Ghana | 0.2 /100 | #249 | Tragic 14.2% |
| Cree | 0.2 /100 | #250 | Tragic 14.2% |