Immigrants vs Sudanese Poverty
COMPARE
Immigrants
Sudanese
Poverty
Poverty Comparison
Immigrants
Sudanese
13.2%
POVERTY
4.3/ 100
METRIC RATING
212th/ 347
METRIC RANK
14.0%
POVERTY
0.3/ 100
METRIC RATING
243rd/ 347
METRIC RANK
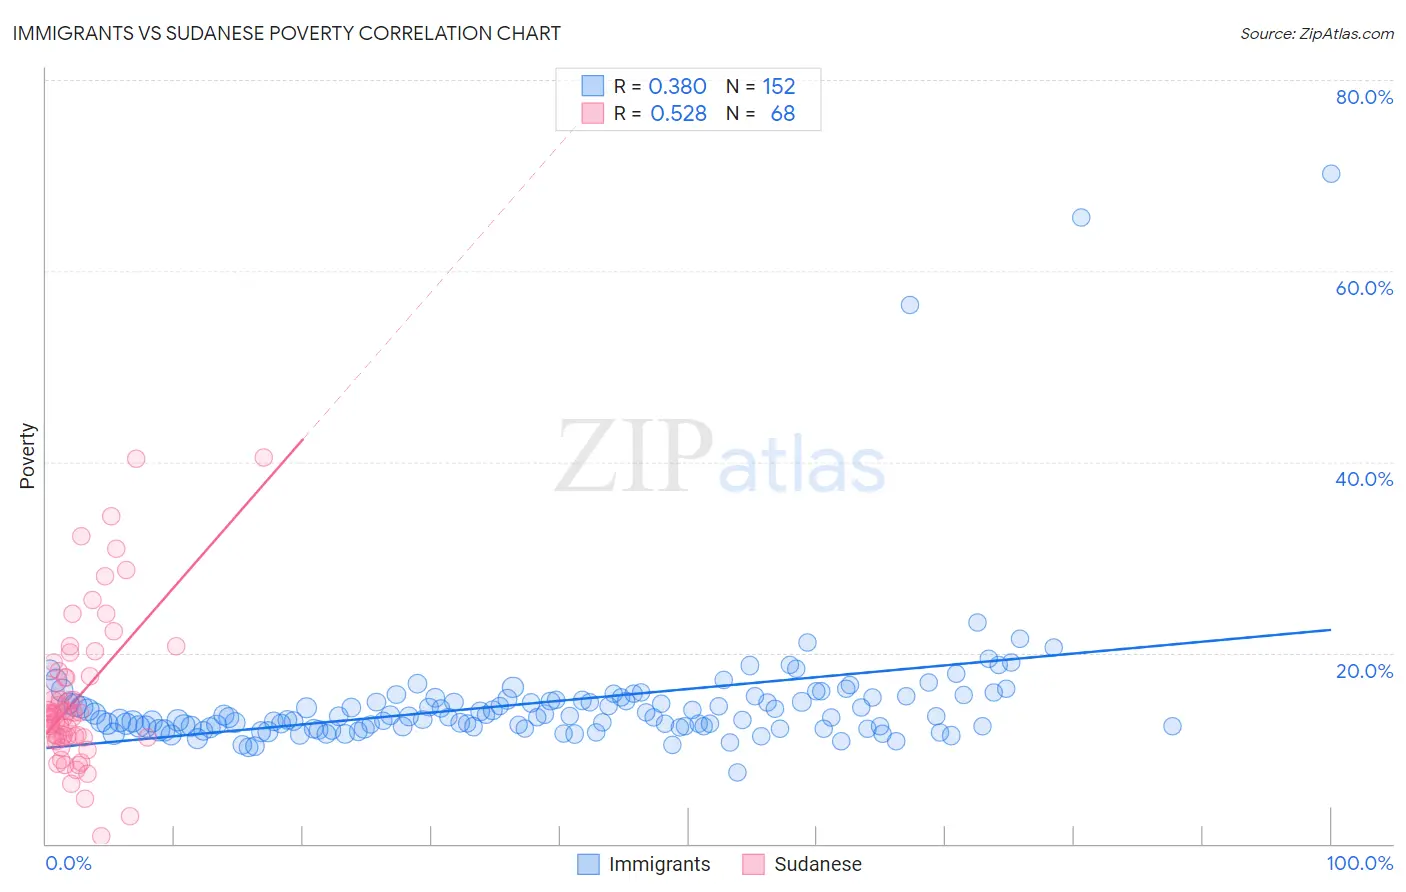
Immigrants vs Sudanese Poverty Correlation Chart
The statistical analysis conducted on geographies consisting of 576,811,759 people shows a mild positive correlation between the proportion of Immigrants and poverty level in the United States with a correlation coefficient (R) of 0.380 and weighted average of 13.2%. Similarly, the statistical analysis conducted on geographies consisting of 110,120,634 people shows a substantial positive correlation between the proportion of Sudanese and poverty level in the United States with a correlation coefficient (R) of 0.528 and weighted average of 14.0%, a difference of 5.8%.
Poverty Correlation Summary
| Measurement | Immigrants | Sudanese |
| Minimum | 7.5% | 0.75% |
| Maximum | 70.2% | 40.5% |
| Range | 62.7% | 39.8% |
| Mean | 14.8% | 15.4% |
| Median | 13.3% | 13.4% |
| Interquartile 25% (IQ1) | 12.3% | 11.2% |
| Interquartile 75% (IQ3) | 15.1% | 17.8% |
| Interquartile Range (IQR) | 2.8% | 6.6% |
| Standard Deviation (Sample) | 7.5% | 7.9% |
| Standard Deviation (Population) | 7.4% | 7.8% |
Similar Demographics by Poverty
Demographics Similar to Immigrants by Poverty
In terms of poverty, the demographic groups most similar to Immigrants are Immigrants from Panama (13.3%, a difference of 0.13%), Bermudan (13.3%, a difference of 0.39%), Moroccan (13.2%, a difference of 0.45%), Japanese (13.3%, a difference of 0.65%), and Nonimmigrants (13.3%, a difference of 0.65%).
| Demographics | Rating | Rank | Poverty |
| Tsimshian | 9.2 /100 | #205 | Tragic 13.0% |
| Immigrants | Eastern Africa | 7.0 /100 | #206 | Tragic 13.1% |
| Panamanians | 6.6 /100 | #207 | Tragic 13.1% |
| Ugandans | 6.2 /100 | #208 | Tragic 13.1% |
| Malaysians | 6.1 /100 | #209 | Tragic 13.1% |
| Immigrants | Azores | 6.1 /100 | #210 | Tragic 13.1% |
| Moroccans | 5.2 /100 | #211 | Tragic 13.2% |
| Immigrants | Immigrants | 4.3 /100 | #212 | Tragic 13.2% |
| Immigrants | Panama | 4.1 /100 | #213 | Tragic 13.3% |
| Bermudans | 3.7 /100 | #214 | Tragic 13.3% |
| Japanese | 3.3 /100 | #215 | Tragic 13.3% |
| Immigrants | Nonimmigrants | 3.3 /100 | #216 | Tragic 13.3% |
| Immigrants | Uzbekistan | 3.2 /100 | #217 | Tragic 13.3% |
| Immigrants | Thailand | 3.1 /100 | #218 | Tragic 13.3% |
| Immigrants | Cambodia | 3.0 /100 | #219 | Tragic 13.4% |
Demographics Similar to Sudanese by Poverty
In terms of poverty, the demographic groups most similar to Sudanese are Nepalese (14.0%, a difference of 0.030%), Ecuadorian (14.0%, a difference of 0.070%), Salvadoran (14.0%, a difference of 0.39%), Immigrants from Middle Africa (14.0%, a difference of 0.41%), and Immigrants from Sudan (14.1%, a difference of 0.42%).
| Demographics | Rating | Rank | Poverty |
| Immigrants | Armenia | 0.5 /100 | #236 | Tragic 13.9% |
| French American Indians | 0.5 /100 | #237 | Tragic 13.9% |
| Ghanaians | 0.5 /100 | #238 | Tragic 13.9% |
| Nicaraguans | 0.4 /100 | #239 | Tragic 13.9% |
| Immigrants | Middle Africa | 0.4 /100 | #240 | Tragic 14.0% |
| Salvadorans | 0.4 /100 | #241 | Tragic 14.0% |
| Ecuadorians | 0.4 /100 | #242 | Tragic 14.0% |
| Sudanese | 0.3 /100 | #243 | Tragic 14.0% |
| Nepalese | 0.3 /100 | #244 | Tragic 14.0% |
| Immigrants | Sudan | 0.3 /100 | #245 | Tragic 14.1% |
| Potawatomi | 0.3 /100 | #246 | Tragic 14.1% |
| Liberians | 0.2 /100 | #247 | Tragic 14.1% |
| Immigrants | Western Africa | 0.2 /100 | #248 | Tragic 14.1% |
| Immigrants | Ghana | 0.2 /100 | #249 | Tragic 14.2% |
| Cree | 0.2 /100 | #250 | Tragic 14.2% |