Ukrainian vs Menominee Male Poverty
COMPARE
Ukrainian
Menominee
Male Poverty
Male Poverty Comparison
Ukrainians
Menominee
10.1%
MALE POVERTY
97.9/ 100
METRIC RATING
60th/ 347
METRIC RANK
15.3%
MALE POVERTY
0.0/ 100
METRIC RATING
324th/ 347
METRIC RANK
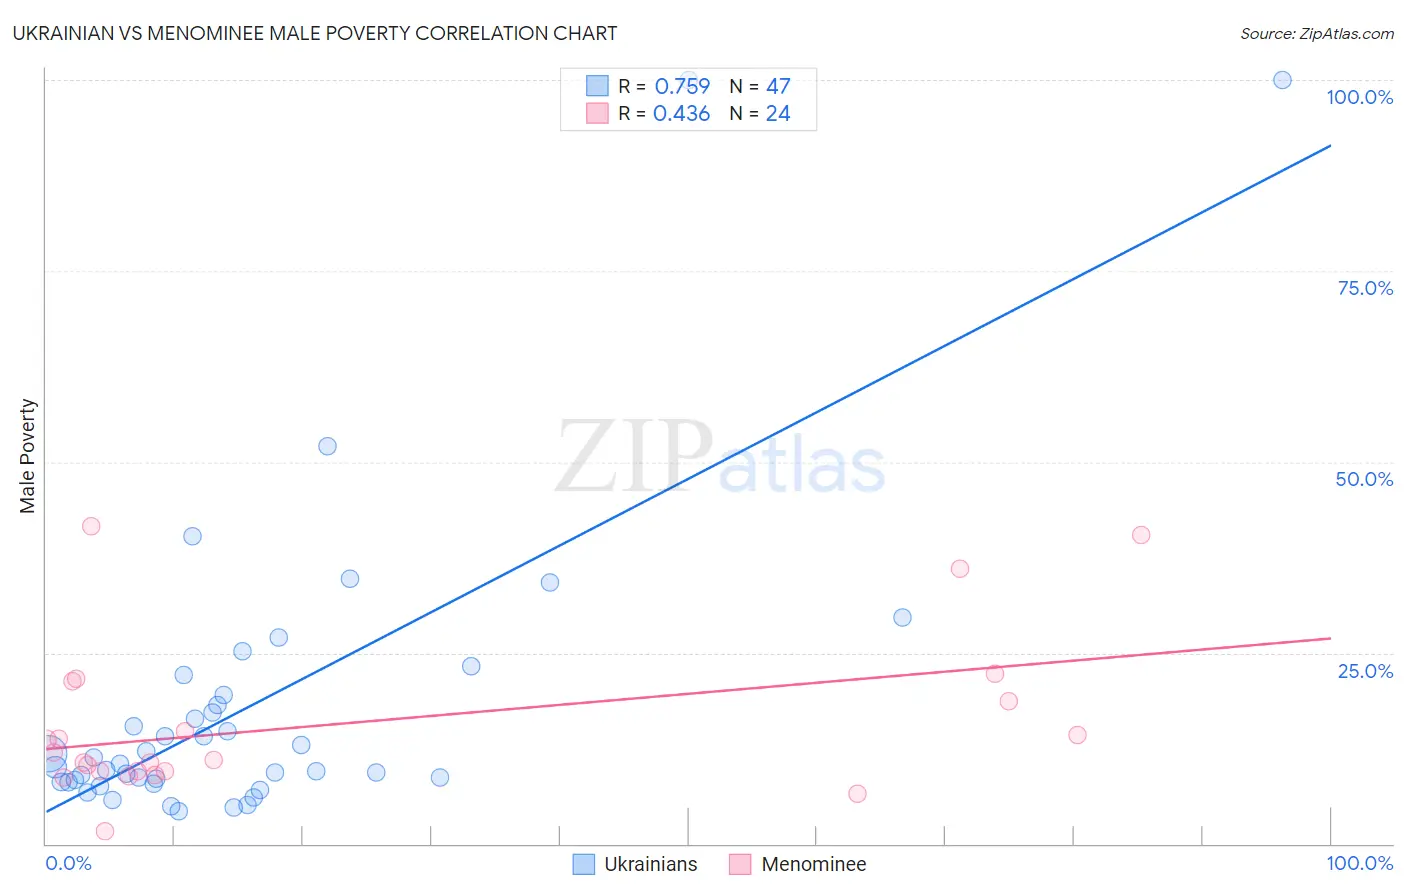
Ukrainian vs Menominee Male Poverty Correlation Chart
The statistical analysis conducted on geographies consisting of 447,972,433 people shows a strong positive correlation between the proportion of Ukrainians and poverty level among males in the United States with a correlation coefficient (R) of 0.759 and weighted average of 10.1%. Similarly, the statistical analysis conducted on geographies consisting of 45,777,105 people shows a moderate positive correlation between the proportion of Menominee and poverty level among males in the United States with a correlation coefficient (R) of 0.436 and weighted average of 15.3%, a difference of 50.6%.
Male Poverty Correlation Summary
| Measurement | Ukrainian | Menominee |
| Minimum | 4.2% | 1.6% |
| Maximum | 100.0% | 41.6% |
| Range | 95.8% | 40.0% |
| Mean | 18.1% | 15.6% |
| Median | 10.5% | 11.5% |
| Interquartile 25% (IQ1) | 8.1% | 9.4% |
| Interquartile 75% (IQ3) | 19.5% | 19.9% |
| Interquartile Range (IQR) | 11.4% | 10.5% |
| Standard Deviation (Sample) | 20.2% | 10.4% |
| Standard Deviation (Population) | 20.0% | 10.2% |
Similar Demographics by Male Poverty
Demographics Similar to Ukrainians by Male Poverty
In terms of male poverty, the demographic groups most similar to Ukrainians are Austrian (10.1%, a difference of 0.020%), Immigrants from Europe (10.1%, a difference of 0.090%), Immigrants from Italy (10.2%, a difference of 0.11%), Slovak (10.2%, a difference of 0.15%), and Scandinavian (10.1%, a difference of 0.22%).
| Demographics | Rating | Rank | Male Poverty |
| Immigrants | Czechoslovakia | 98.6 /100 | #53 | Exceptional 10.0% |
| Immigrants | Austria | 98.5 /100 | #54 | Exceptional 10.0% |
| Germans | 98.3 /100 | #55 | Exceptional 10.1% |
| Immigrants | Bulgaria | 98.2 /100 | #56 | Exceptional 10.1% |
| Estonians | 98.1 /100 | #57 | Exceptional 10.1% |
| Scandinavians | 98.0 /100 | #58 | Exceptional 10.1% |
| Immigrants | Europe | 97.9 /100 | #59 | Exceptional 10.1% |
| Ukrainians | 97.9 /100 | #60 | Exceptional 10.1% |
| Austrians | 97.8 /100 | #61 | Exceptional 10.1% |
| Immigrants | Italy | 97.8 /100 | #62 | Exceptional 10.2% |
| Slovaks | 97.7 /100 | #63 | Exceptional 10.2% |
| Swiss | 97.5 /100 | #64 | Exceptional 10.2% |
| Zimbabweans | 97.5 /100 | #65 | Exceptional 10.2% |
| Serbians | 97.5 /100 | #66 | Exceptional 10.2% |
| Immigrants | Netherlands | 97.3 /100 | #67 | Exceptional 10.2% |
Demographics Similar to Menominee by Male Poverty
In terms of male poverty, the demographic groups most similar to Menominee are Yakama (15.3%, a difference of 0.18%), Colville (15.2%, a difference of 0.19%), Central American Indian (15.3%, a difference of 0.29%), Kiowa (15.2%, a difference of 0.58%), and Arapaho (15.1%, a difference of 1.3%).
| Demographics | Rating | Rank | Male Poverty |
| Immigrants | Dominica | 0.0 /100 | #317 | Tragic 14.7% |
| Immigrants | Grenada | 0.0 /100 | #318 | Tragic 14.7% |
| U.S. Virgin Islanders | 0.0 /100 | #319 | Tragic 14.7% |
| Immigrants | Congo | 0.0 /100 | #320 | Tragic 14.7% |
| Arapaho | 0.0 /100 | #321 | Tragic 15.1% |
| Kiowa | 0.0 /100 | #322 | Tragic 15.2% |
| Colville | 0.0 /100 | #323 | Tragic 15.2% |
| Menominee | 0.0 /100 | #324 | Tragic 15.3% |
| Yakama | 0.0 /100 | #325 | Tragic 15.3% |
| Central American Indians | 0.0 /100 | #326 | Tragic 15.3% |
| Paiute | 0.0 /100 | #327 | Tragic 15.8% |
| Blacks/African Americans | 0.0 /100 | #328 | Tragic 15.8% |
| Dominicans | 0.0 /100 | #329 | Tragic 16.1% |
| Immigrants | Dominican Republic | 0.0 /100 | #330 | Tragic 16.2% |
| Ute | 0.0 /100 | #331 | Tragic 16.2% |