Mongolian vs Menominee Family Households
COMPARE
Mongolian
Menominee
Family Households
Family Households Comparison
Mongolians
Menominee
62.8%
FAMILY HOUSEHOLDS
0.1/ 100
METRIC RATING
285th/ 347
METRIC RANK
66.5%
FAMILY HOUSEHOLDS
100.0/ 100
METRIC RATING
42nd/ 347
METRIC RANK
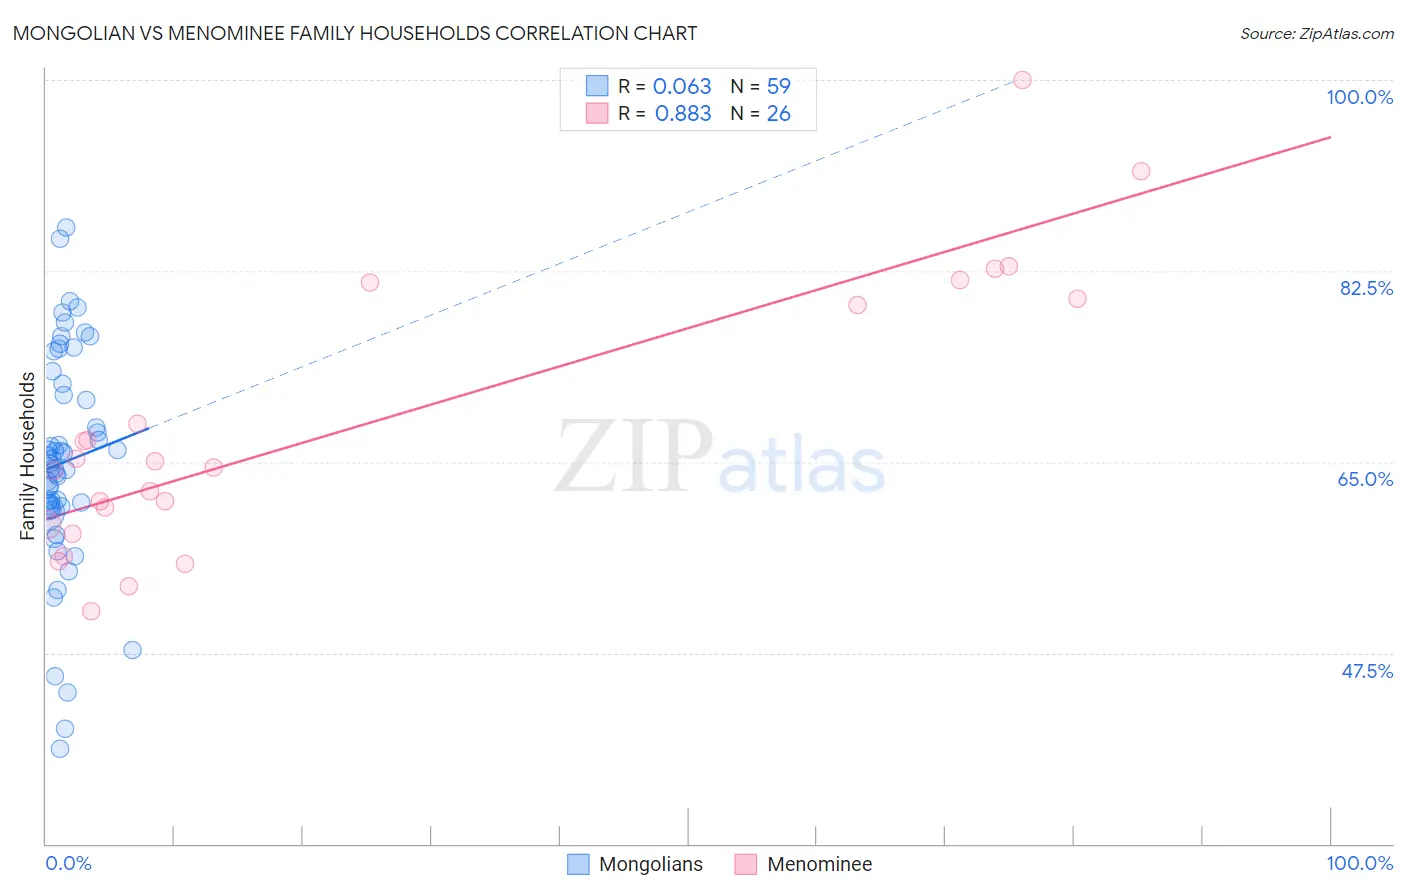
Mongolian vs Menominee Family Households Correlation Chart
The statistical analysis conducted on geographies consisting of 140,293,840 people shows a slight positive correlation between the proportion of Mongolians and percentage of family households in the United States with a correlation coefficient (R) of 0.063 and weighted average of 62.8%. Similarly, the statistical analysis conducted on geographies consisting of 45,777,849 people shows a very strong positive correlation between the proportion of Menominee and percentage of family households in the United States with a correlation coefficient (R) of 0.883 and weighted average of 66.5%, a difference of 6.0%.
Family Households Correlation Summary
| Measurement | Mongolian | Menominee |
| Minimum | 38.8% | 51.3% |
| Maximum | 86.5% | 100.0% |
| Range | 47.8% | 48.7% |
| Mean | 65.0% | 68.4% |
| Median | 64.9% | 64.8% |
| Interquartile 25% (IQ1) | 60.9% | 59.2% |
| Interquartile 75% (IQ3) | 72.2% | 80.0% |
| Interquartile Range (IQR) | 11.3% | 20.8% |
| Standard Deviation (Sample) | 10.1% | 12.6% |
| Standard Deviation (Population) | 10.0% | 12.4% |
Similar Demographics by Family Households
Demographics Similar to Mongolians by Family Households
In terms of family households, the demographic groups most similar to Mongolians are British West Indian (62.8%, a difference of 0.030%), Latvian (62.8%, a difference of 0.030%), Immigrants from Uganda (62.7%, a difference of 0.050%), Australian (62.8%, a difference of 0.10%), and Immigrants from Nepal (62.7%, a difference of 0.14%).
| Demographics | Rating | Rank | Family Households |
| Immigrants | Belgium | 0.2 /100 | #278 | Tragic 63.0% |
| Immigrants | Yemen | 0.2 /100 | #279 | Tragic 63.0% |
| Immigrants | Bulgaria | 0.2 /100 | #280 | Tragic 63.0% |
| Estonians | 0.2 /100 | #281 | Tragic 62.9% |
| New Zealanders | 0.1 /100 | #282 | Tragic 62.9% |
| Immigrants | Denmark | 0.1 /100 | #283 | Tragic 62.9% |
| Australians | 0.1 /100 | #284 | Tragic 62.8% |
| Mongolians | 0.1 /100 | #285 | Tragic 62.8% |
| British West Indians | 0.1 /100 | #286 | Tragic 62.8% |
| Latvians | 0.1 /100 | #287 | Tragic 62.8% |
| Immigrants | Uganda | 0.1 /100 | #288 | Tragic 62.7% |
| Immigrants | Nepal | 0.1 /100 | #289 | Tragic 62.7% |
| Immigrants | Grenada | 0.0 /100 | #290 | Tragic 62.6% |
| U.S. Virgin Islanders | 0.0 /100 | #291 | Tragic 62.6% |
| Immigrants | Burma/Myanmar | 0.0 /100 | #292 | Tragic 62.6% |
Demographics Similar to Menominee by Family Households
In terms of family households, the demographic groups most similar to Menominee are Apache (66.5%, a difference of 0.010%), Immigrants from Bolivia (66.6%, a difference of 0.060%), Asian (66.5%, a difference of 0.060%), Venezuelan (66.5%, a difference of 0.080%), and Guamanian/Chamorro (66.6%, a difference of 0.090%).
| Demographics | Rating | Rank | Family Households |
| Tohono O'odham | 100.0 /100 | #35 | Exceptional 67.1% |
| Peruvians | 100.0 /100 | #36 | Exceptional 67.1% |
| Tsimshian | 100.0 /100 | #37 | Exceptional 67.1% |
| Mexican American Indians | 100.0 /100 | #38 | Exceptional 67.0% |
| Immigrants | El Salvador | 100.0 /100 | #39 | Exceptional 67.0% |
| Guamanians/Chamorros | 100.0 /100 | #40 | Exceptional 66.6% |
| Immigrants | Bolivia | 100.0 /100 | #41 | Exceptional 66.6% |
| Menominee | 100.0 /100 | #42 | Exceptional 66.5% |
| Apache | 100.0 /100 | #43 | Exceptional 66.5% |
| Asians | 100.0 /100 | #44 | Exceptional 66.5% |
| Venezuelans | 100.0 /100 | #45 | Exceptional 66.5% |
| Arapaho | 100.0 /100 | #46 | Exceptional 66.5% |
| Bolivians | 100.0 /100 | #47 | Exceptional 66.5% |
| Immigrants | Venezuela | 100.0 /100 | #48 | Exceptional 66.4% |
| Immigrants | South Central Asia | 100.0 /100 | #49 | Exceptional 66.4% |