Korean vs Immigrants from Australia Single Father Poverty
COMPARE
Korean
Immigrants from Australia
Single Father Poverty
Single Father Poverty Comparison
Koreans
Immigrants from Australia
14.0%
SINGLE FATHER POVERTY
100.0/ 100
METRIC RATING
10th/ 347
METRIC RANK
15.7%
SINGLE FATHER POVERTY
96.1/ 100
METRIC RATING
105th/ 347
METRIC RANK
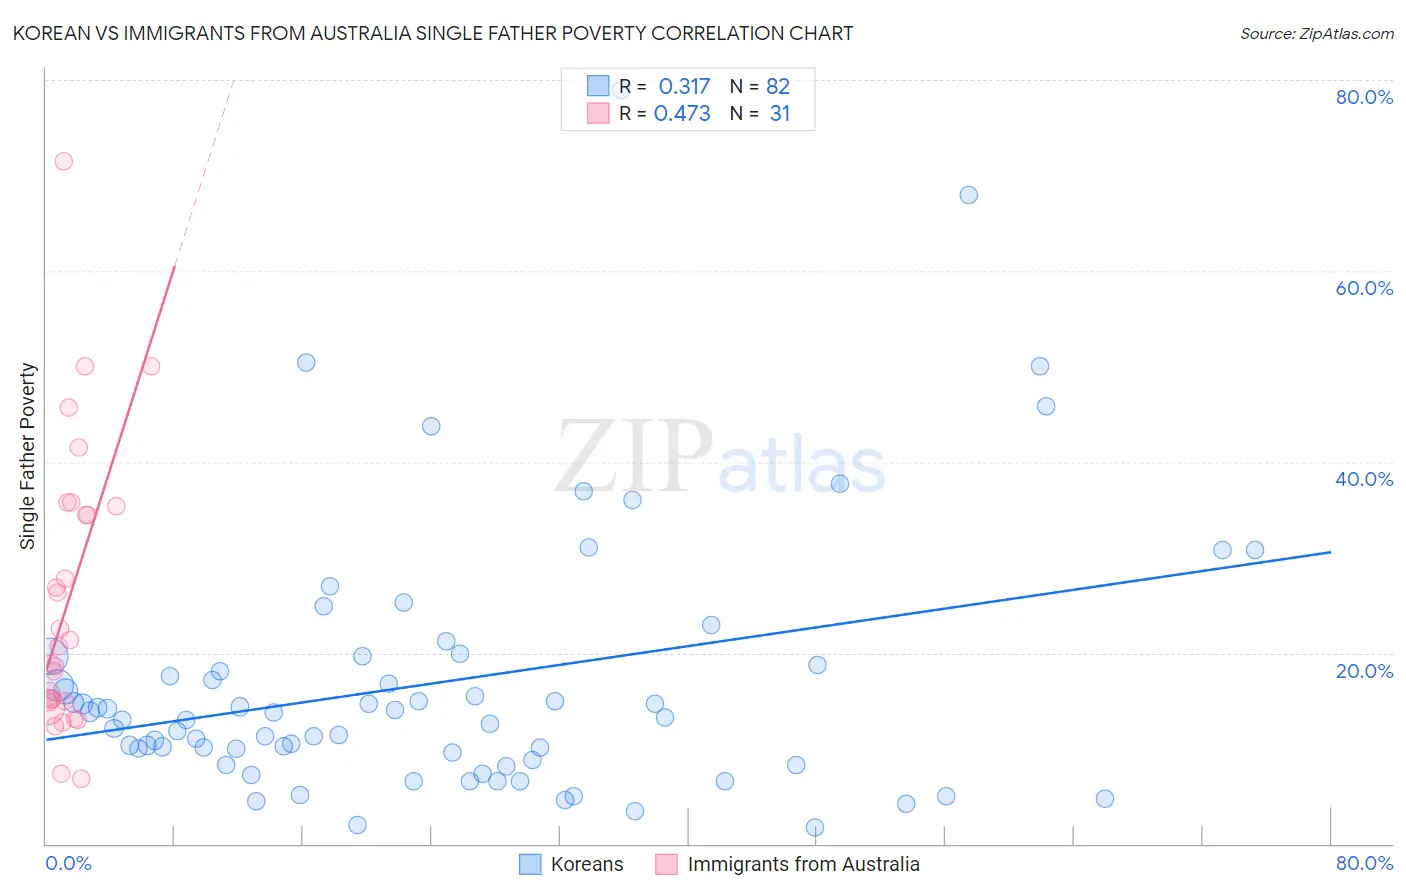
Korean vs Immigrants from Australia Single Father Poverty Correlation Chart
The statistical analysis conducted on geographies consisting of 383,489,954 people shows a mild positive correlation between the proportion of Koreans and poverty level among single fathers in the United States with a correlation coefficient (R) of 0.317 and weighted average of 14.0%. Similarly, the statistical analysis conducted on geographies consisting of 187,295,963 people shows a moderate positive correlation between the proportion of Immigrants from Australia and poverty level among single fathers in the United States with a correlation coefficient (R) of 0.473 and weighted average of 15.7%, a difference of 12.5%.
Single Father Poverty Correlation Summary
| Measurement | Korean | Immigrants from Australia |
| Minimum | 1.8% | 6.8% |
| Maximum | 78.9% | 71.5% |
| Range | 77.1% | 64.7% |
| Mean | 16.9% | 25.5% |
| Median | 13.1% | 20.7% |
| Interquartile 25% (IQ1) | 8.8% | 14.9% |
| Interquartile 75% (IQ3) | 18.8% | 35.3% |
| Interquartile Range (IQR) | 9.9% | 20.4% |
| Standard Deviation (Sample) | 14.0% | 14.9% |
| Standard Deviation (Population) | 13.9% | 14.6% |
Similar Demographics by Single Father Poverty
Demographics Similar to Koreans by Single Father Poverty
In terms of single father poverty, the demographic groups most similar to Koreans are Afghan (14.0%, a difference of 0.10%), Filipino (14.0%, a difference of 0.40%), Immigrants from India (14.0%, a difference of 0.41%), Immigrants from Philippines (14.0%, a difference of 0.55%), and Samoan (13.8%, a difference of 1.2%).
| Demographics | Rating | Rank | Single Father Poverty |
| Tsimshian | 100.0 /100 | #3 | Exceptional 12.7% |
| Immigrants | Fiji | 100.0 /100 | #4 | Exceptional 13.2% |
| Immigrants | Ethiopia | 100.0 /100 | #5 | Exceptional 13.4% |
| Ethiopians | 100.0 /100 | #6 | Exceptional 13.5% |
| Immigrants | Taiwan | 100.0 /100 | #7 | Exceptional 13.7% |
| Samoans | 100.0 /100 | #8 | Exceptional 13.8% |
| Afghans | 100.0 /100 | #9 | Exceptional 14.0% |
| Koreans | 100.0 /100 | #10 | Exceptional 14.0% |
| Filipinos | 100.0 /100 | #11 | Exceptional 14.0% |
| Immigrants | India | 100.0 /100 | #12 | Exceptional 14.0% |
| Immigrants | Philippines | 100.0 /100 | #13 | Exceptional 14.0% |
| Immigrants | Vietnam | 100.0 /100 | #14 | Exceptional 14.1% |
| Sri Lankans | 100.0 /100 | #15 | Exceptional 14.2% |
| Immigrants | Iran | 100.0 /100 | #16 | Exceptional 14.2% |
| Immigrants | Hong Kong | 100.0 /100 | #17 | Exceptional 14.2% |
Demographics Similar to Immigrants from Australia by Single Father Poverty
In terms of single father poverty, the demographic groups most similar to Immigrants from Australia are Australian (15.7%, a difference of 0.010%), South American Indian (15.7%, a difference of 0.030%), Immigrants from Poland (15.7%, a difference of 0.070%), Native Hawaiian (15.7%, a difference of 0.090%), and Chilean (15.7%, a difference of 0.10%).
| Demographics | Rating | Rank | Single Father Poverty |
| Zimbabweans | 98.1 /100 | #98 | Exceptional 15.6% |
| Immigrants | Middle Africa | 97.4 /100 | #99 | Exceptional 15.6% |
| Immigrants | Chile | 96.9 /100 | #100 | Exceptional 15.7% |
| Fijians | 96.8 /100 | #101 | Exceptional 15.7% |
| Chileans | 96.4 /100 | #102 | Exceptional 15.7% |
| South American Indians | 96.2 /100 | #103 | Exceptional 15.7% |
| Australians | 96.1 /100 | #104 | Exceptional 15.7% |
| Immigrants | Australia | 96.1 /100 | #105 | Exceptional 15.7% |
| Immigrants | Poland | 95.8 /100 | #106 | Exceptional 15.7% |
| Native Hawaiians | 95.8 /100 | #107 | Exceptional 15.7% |
| Pakistanis | 95.7 /100 | #108 | Exceptional 15.7% |
| Turks | 95.1 /100 | #109 | Exceptional 15.8% |
| Immigrants | Africa | 95.1 /100 | #110 | Exceptional 15.8% |
| Bulgarians | 94.8 /100 | #111 | Exceptional 15.8% |
| Immigrants | Latvia | 94.7 /100 | #112 | Exceptional 15.8% |