Mexican vs Potawatomi Child Poverty Among Girls Under 16
COMPARE
Mexican
Potawatomi
Child Poverty Among Girls Under 16
Child Poverty Among Girls Under 16 Comparison
Mexicans
Potawatomi
20.9%
CHILD POVERTY AMONG GIRLS UNDER 16
0.0/ 100
METRIC RATING
298th/ 347
METRIC RANK
19.2%
CHILD POVERTY AMONG GIRLS UNDER 16
0.3/ 100
METRIC RATING
249th/ 347
METRIC RANK
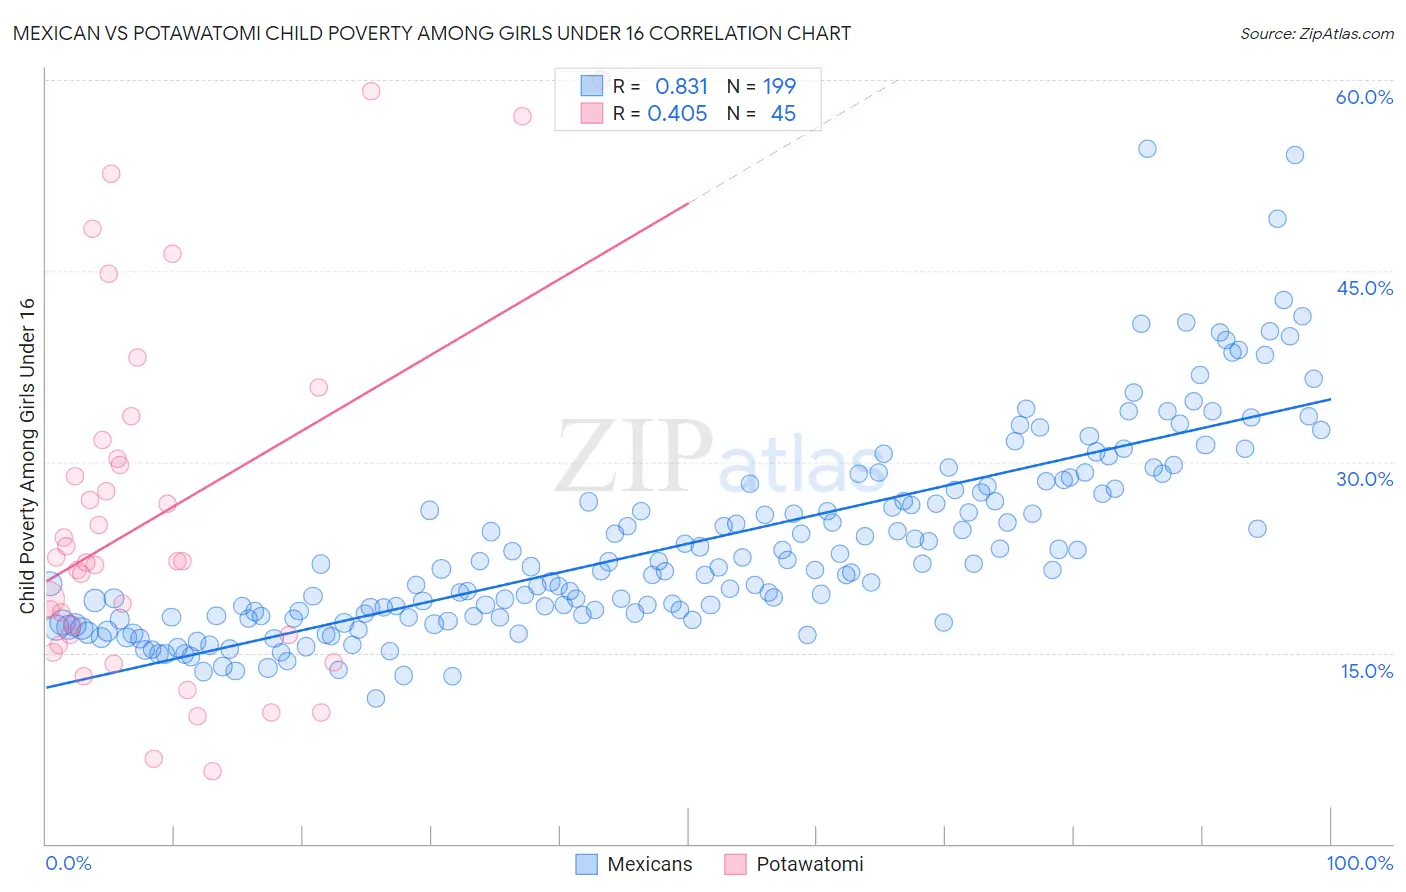
Mexican vs Potawatomi Child Poverty Among Girls Under 16 Correlation Chart
The statistical analysis conducted on geographies consisting of 545,930,969 people shows a very strong positive correlation between the proportion of Mexicans and poverty level among girls under the age of 16 in the United States with a correlation coefficient (R) of 0.831 and weighted average of 20.9%. Similarly, the statistical analysis conducted on geographies consisting of 117,080,271 people shows a moderate positive correlation between the proportion of Potawatomi and poverty level among girls under the age of 16 in the United States with a correlation coefficient (R) of 0.405 and weighted average of 19.2%, a difference of 8.6%.
Child Poverty Among Girls Under 16 Correlation Summary
| Measurement | Mexican | Potawatomi |
| Minimum | 11.4% | 5.7% |
| Maximum | 54.6% | 60.0% |
| Range | 43.2% | 54.3% |
| Mean | 23.5% | 25.7% |
| Median | 21.5% | 22.2% |
| Interquartile 25% (IQ1) | 17.8% | 16.0% |
| Interquartile 75% (IQ3) | 27.8% | 31.0% |
| Interquartile Range (IQR) | 10.0% | 15.0% |
| Standard Deviation (Sample) | 7.9% | 14.0% |
| Standard Deviation (Population) | 7.8% | 13.8% |
Similar Demographics by Child Poverty Among Girls Under 16
Demographics Similar to Mexicans by Child Poverty Among Girls Under 16
In terms of child poverty among girls under 16, the demographic groups most similar to Mexicans are Hispanic or Latino (21.0%, a difference of 0.40%), Inupiat (20.8%, a difference of 0.52%), Immigrants from West Indies (20.7%, a difference of 0.59%), Somali (21.0%, a difference of 0.72%), and Immigrants from Caribbean (20.7%, a difference of 0.87%).
| Demographics | Rating | Rank | Child Poverty Among Girls Under 16 |
| Chippewa | 0.0 /100 | #291 | Tragic 20.6% |
| Immigrants | Latin America | 0.0 /100 | #292 | Tragic 20.6% |
| Immigrants | Grenada | 0.0 /100 | #293 | Tragic 20.7% |
| Immigrants | Senegal | 0.0 /100 | #294 | Tragic 20.7% |
| Immigrants | Caribbean | 0.0 /100 | #295 | Tragic 20.7% |
| Immigrants | West Indies | 0.0 /100 | #296 | Tragic 20.7% |
| Inupiat | 0.0 /100 | #297 | Tragic 20.8% |
| Mexicans | 0.0 /100 | #298 | Tragic 20.9% |
| Hispanics or Latinos | 0.0 /100 | #299 | Tragic 21.0% |
| Somalis | 0.0 /100 | #300 | Tragic 21.0% |
| Choctaw | 0.0 /100 | #301 | Tragic 21.1% |
| Seminole | 0.0 /100 | #302 | Tragic 21.2% |
| British West Indians | 0.0 /100 | #303 | Tragic 21.3% |
| Indonesians | 0.0 /100 | #304 | Tragic 21.3% |
| Guatemalans | 0.0 /100 | #305 | Tragic 21.4% |
Demographics Similar to Potawatomi by Child Poverty Among Girls Under 16
In terms of child poverty among girls under 16, the demographic groups most similar to Potawatomi are French American Indian (19.2%, a difference of 0.020%), Cape Verdean (19.2%, a difference of 0.030%), Immigrants from Trinidad and Tobago (19.2%, a difference of 0.14%), Immigrants from Middle Africa (19.2%, a difference of 0.18%), and Immigrants from Guyana (19.3%, a difference of 0.38%).
| Demographics | Rating | Rank | Child Poverty Among Girls Under 16 |
| Immigrants | Cuba | 0.7 /100 | #242 | Tragic 18.8% |
| Immigrants | Nicaragua | 0.7 /100 | #243 | Tragic 18.8% |
| Ecuadorians | 0.7 /100 | #244 | Tragic 18.8% |
| Shoshone | 0.6 /100 | #245 | Tragic 18.9% |
| Immigrants | Laos | 0.6 /100 | #246 | Tragic 18.9% |
| Immigrants | Ghana | 0.5 /100 | #247 | Tragic 18.9% |
| French American Indians | 0.3 /100 | #248 | Tragic 19.2% |
| Potawatomi | 0.3 /100 | #249 | Tragic 19.2% |
| Cape Verdeans | 0.3 /100 | #250 | Tragic 19.2% |
| Immigrants | Trinidad and Tobago | 0.3 /100 | #251 | Tragic 19.2% |
| Immigrants | Middle Africa | 0.3 /100 | #252 | Tragic 19.2% |
| Immigrants | Guyana | 0.3 /100 | #253 | Tragic 19.3% |
| Immigrants | Western Africa | 0.3 /100 | #254 | Tragic 19.3% |
| Immigrants | Ecuador | 0.3 /100 | #255 | Tragic 19.3% |
| Trinidadians and Tobagonians | 0.2 /100 | #256 | Tragic 19.3% |