Mexican vs German Householder Income Ages 25 - 44 years
COMPARE
Mexican
German
Householder Income Ages 25 - 44 years
Householder Income Ages 25 - 44 years Comparison
Mexicans
Germans
$80,427
HOUSEHOLDER INCOME AGES 25 - 44 YEARS
0.0/ 100
METRIC RATING
303rd/ 347
METRIC RANK
$93,531
HOUSEHOLDER INCOME AGES 25 - 44 YEARS
36.0/ 100
METRIC RATING
184th/ 347
METRIC RANK
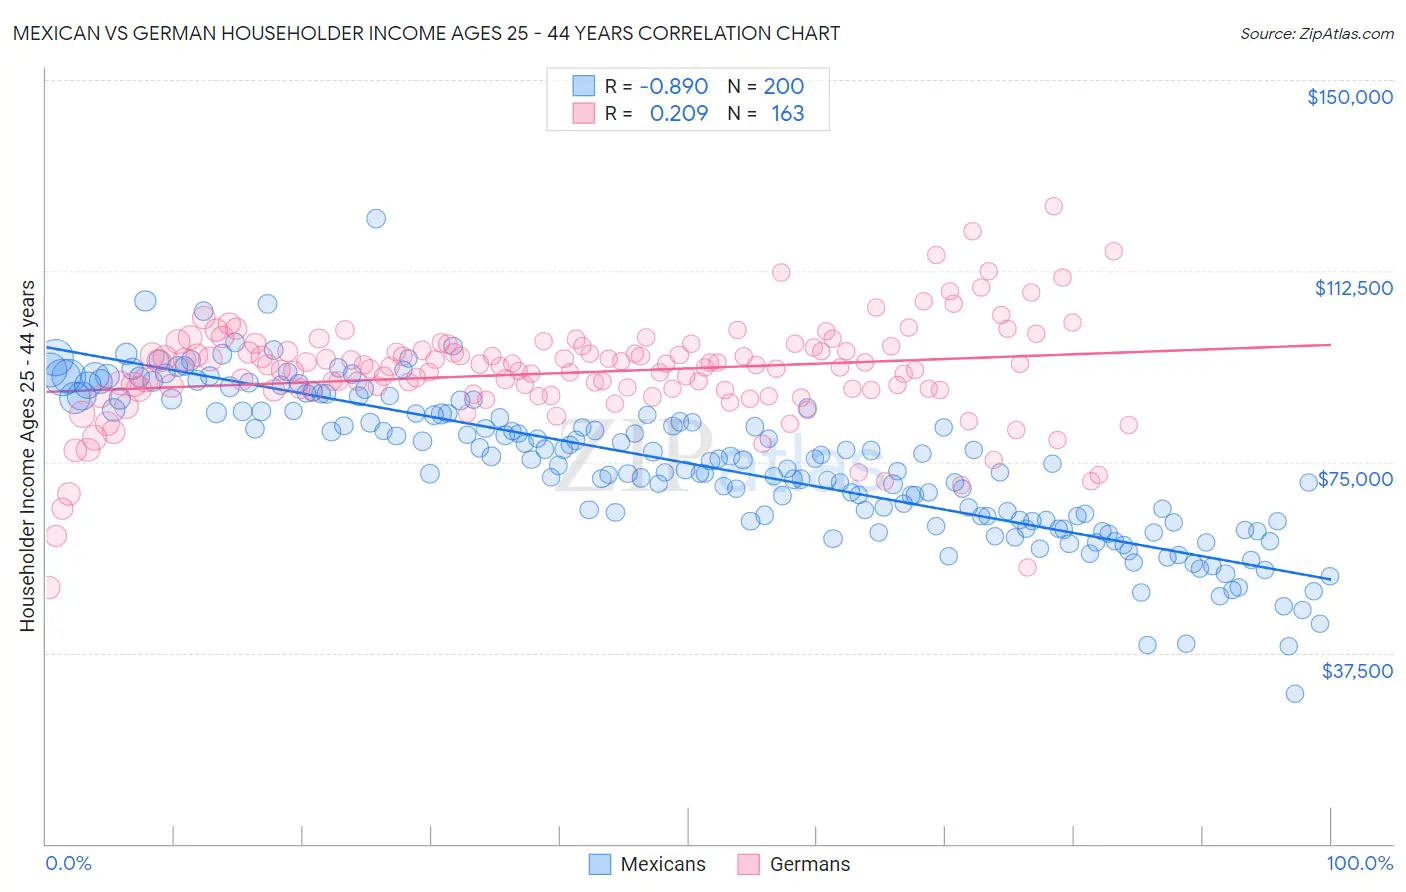
Mexican vs German Householder Income Ages 25 - 44 years Correlation Chart
The statistical analysis conducted on geographies consisting of 559,949,766 people shows a very strong negative correlation between the proportion of Mexicans and household income with householder between the ages 25 and 44 in the United States with a correlation coefficient (R) of -0.890 and weighted average of $80,427. Similarly, the statistical analysis conducted on geographies consisting of 573,342,679 people shows a weak positive correlation between the proportion of Germans and household income with householder between the ages 25 and 44 in the United States with a correlation coefficient (R) of 0.209 and weighted average of $93,531, a difference of 16.3%.
Householder Income Ages 25 - 44 years Correlation Summary
| Measurement | Mexican | German |
| Minimum | $29,496 | $50,351 |
| Maximum | $122,837 | $125,193 |
| Range | $93,341 | $74,841 |
| Mean | $74,718 | $92,516 |
| Median | $75,510 | $93,847 |
| Interquartile 25% (IQ1) | $63,535 | $89,053 |
| Interquartile 75% (IQ3) | $85,434 | $97,570 |
| Interquartile Range (IQR) | $21,899 | $8,517 |
| Standard Deviation (Sample) | $14,848 | $10,480 |
| Standard Deviation (Population) | $14,811 | $10,448 |
Similar Demographics by Householder Income Ages 25 - 44 years
Demographics Similar to Mexicans by Householder Income Ages 25 - 44 years
In terms of householder income ages 25 - 44 years, the demographic groups most similar to Mexicans are Hispanic or Latino ($80,515, a difference of 0.11%), Immigrants from Caribbean ($80,326, a difference of 0.13%), Immigrants from Dominican Republic ($80,319, a difference of 0.13%), Immigrants from Micronesia ($80,544, a difference of 0.14%), and Apache ($80,260, a difference of 0.21%).
| Demographics | Rating | Rank | Householder Income Ages 25 - 44 years |
| Immigrants | Dominica | 0.1 /100 | #296 | Tragic $81,351 |
| Immigrants | Guatemala | 0.1 /100 | #297 | Tragic $81,341 |
| Dominicans | 0.1 /100 | #298 | Tragic $81,229 |
| Immigrants | Liberia | 0.1 /100 | #299 | Tragic $80,863 |
| Cherokee | 0.0 /100 | #300 | Tragic $80,843 |
| Immigrants | Micronesia | 0.0 /100 | #301 | Tragic $80,544 |
| Hispanics or Latinos | 0.0 /100 | #302 | Tragic $80,515 |
| Mexicans | 0.0 /100 | #303 | Tragic $80,427 |
| Immigrants | Caribbean | 0.0 /100 | #304 | Tragic $80,326 |
| Immigrants | Dominican Republic | 0.0 /100 | #305 | Tragic $80,319 |
| Apache | 0.0 /100 | #306 | Tragic $80,260 |
| Haitians | 0.0 /100 | #307 | Tragic $80,055 |
| Immigrants | Central America | 0.0 /100 | #308 | Tragic $80,012 |
| Chippewa | 0.0 /100 | #309 | Tragic $80,005 |
| Fijians | 0.0 /100 | #310 | Tragic $79,956 |
Demographics Similar to Germans by Householder Income Ages 25 - 44 years
In terms of householder income ages 25 - 44 years, the demographic groups most similar to Germans are Guamanian/Chamorro ($93,569, a difference of 0.040%), Immigrants from Eritrea ($93,466, a difference of 0.070%), Sierra Leonean ($93,435, a difference of 0.10%), Uruguayan ($93,631, a difference of 0.11%), and French ($93,665, a difference of 0.14%).
| Demographics | Rating | Rank | Householder Income Ages 25 - 44 years |
| Belgians | 45.8 /100 | #177 | Average $94,262 |
| Immigrants | South America | 42.8 /100 | #178 | Average $94,042 |
| French Canadians | 38.2 /100 | #179 | Fair $93,694 |
| French | 37.8 /100 | #180 | Fair $93,665 |
| Puget Sound Salish | 37.7 /100 | #181 | Fair $93,661 |
| Uruguayans | 37.3 /100 | #182 | Fair $93,631 |
| Guamanians/Chamorros | 36.5 /100 | #183 | Fair $93,569 |
| Germans | 36.0 /100 | #184 | Fair $93,531 |
| Immigrants | Eritrea | 35.2 /100 | #185 | Fair $93,466 |
| Sierra Leoneans | 34.8 /100 | #186 | Fair $93,435 |
| Spaniards | 34.0 /100 | #187 | Fair $93,366 |
| Immigrants | Sierra Leone | 30.9 /100 | #188 | Fair $93,115 |
| Dutch | 30.5 /100 | #189 | Fair $93,081 |
| Welsh | 30.0 /100 | #190 | Fair $93,039 |
| Tlingit-Haida | 29.4 /100 | #191 | Fair $92,987 |