Mexican vs Immigrants from Korea Male Poverty
COMPARE
Mexican
Immigrants from Korea
Male Poverty
Male Poverty Comparison
Mexicans
Immigrants from Korea
13.7%
MALE POVERTY
0.0/ 100
METRIC RATING
280th/ 347
METRIC RANK
9.7%
MALE POVERTY
99.6/ 100
METRIC RATING
28th/ 347
METRIC RANK
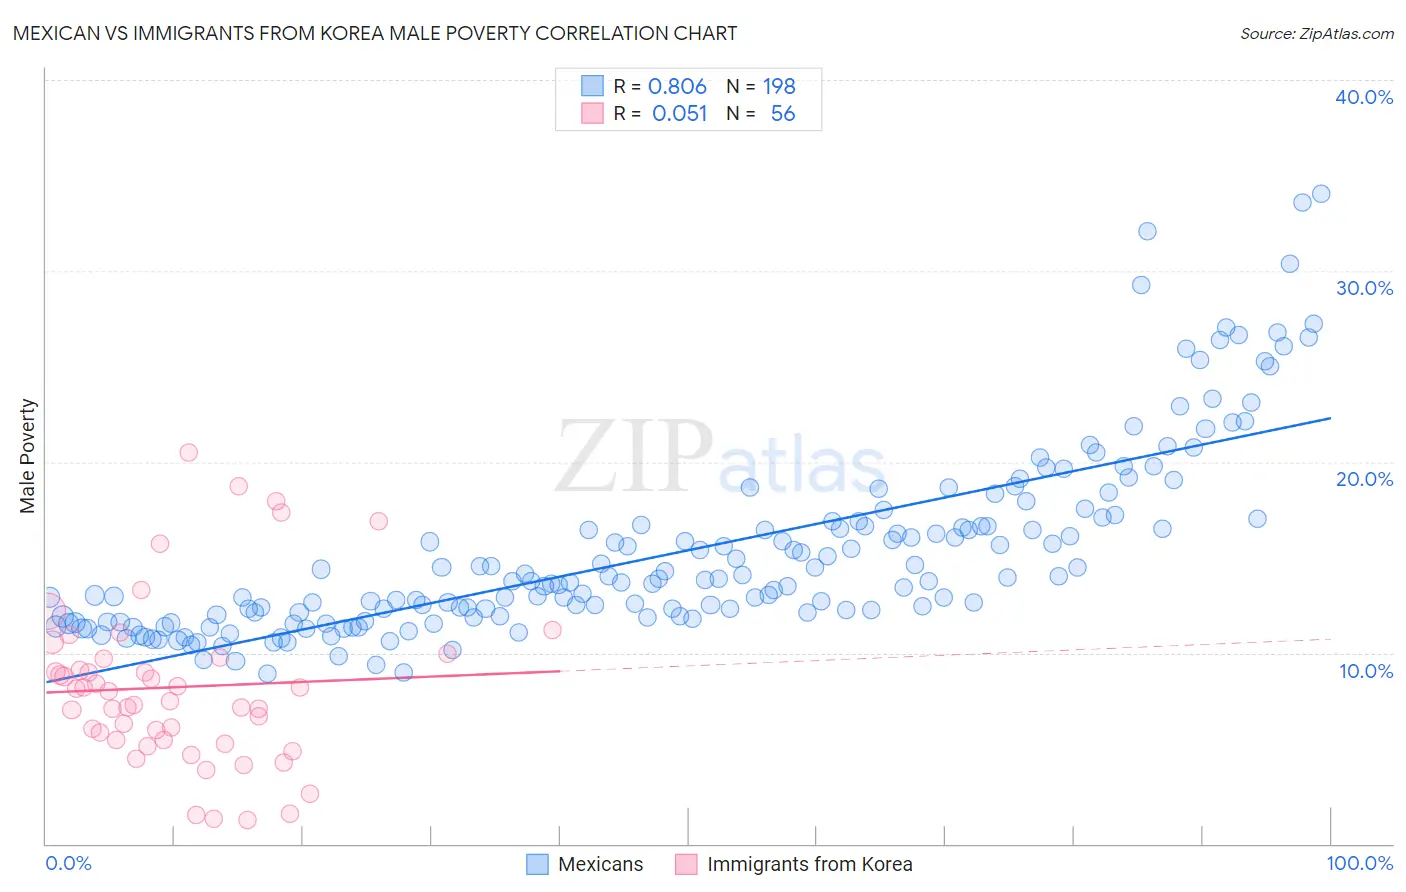
Mexican vs Immigrants from Korea Male Poverty Correlation Chart
The statistical analysis conducted on geographies consisting of 563,818,602 people shows a very strong positive correlation between the proportion of Mexicans and poverty level among males in the United States with a correlation coefficient (R) of 0.806 and weighted average of 13.7%. Similarly, the statistical analysis conducted on geographies consisting of 415,786,791 people shows a slight positive correlation between the proportion of Immigrants from Korea and poverty level among males in the United States with a correlation coefficient (R) of 0.051 and weighted average of 9.7%, a difference of 41.0%.
Male Poverty Correlation Summary
| Measurement | Mexican | Immigrants from Korea |
| Minimum | 8.9% | 1.2% |
| Maximum | 34.1% | 20.5% |
| Range | 25.2% | 19.2% |
| Mean | 15.3% | 8.2% |
| Median | 13.7% | 7.7% |
| Interquartile 25% (IQ1) | 11.9% | 5.4% |
| Interquartile 75% (IQ3) | 16.7% | 9.7% |
| Interquartile Range (IQR) | 4.8% | 4.3% |
| Standard Deviation (Sample) | 4.9% | 4.3% |
| Standard Deviation (Population) | 4.9% | 4.3% |
Similar Demographics by Male Poverty
Demographics Similar to Mexicans by Male Poverty
In terms of male poverty, the demographic groups most similar to Mexicans are Yaqui (13.7%, a difference of 0.050%), Haitian (13.7%, a difference of 0.090%), Belizean (13.6%, a difference of 0.27%), Immigrants from Cabo Verde (13.7%, a difference of 0.32%), and Bangladeshi (13.6%, a difference of 0.37%).
| Demographics | Rating | Rank | Male Poverty |
| Chickasaw | 0.0 /100 | #273 | Tragic 13.5% |
| Immigrants | West Indies | 0.0 /100 | #274 | Tragic 13.5% |
| Barbadians | 0.0 /100 | #275 | Tragic 13.6% |
| Immigrants | Latin America | 0.0 /100 | #276 | Tragic 13.6% |
| Bangladeshis | 0.0 /100 | #277 | Tragic 13.6% |
| Belizeans | 0.0 /100 | #278 | Tragic 13.6% |
| Haitians | 0.0 /100 | #279 | Tragic 13.7% |
| Mexicans | 0.0 /100 | #280 | Tragic 13.7% |
| Yaqui | 0.0 /100 | #281 | Tragic 13.7% |
| Immigrants | Cabo Verde | 0.0 /100 | #282 | Tragic 13.7% |
| Comanche | 0.0 /100 | #283 | Tragic 13.8% |
| Immigrants | Haiti | 0.0 /100 | #284 | Tragic 13.8% |
| West Indians | 0.0 /100 | #285 | Tragic 13.8% |
| Shoshone | 0.0 /100 | #286 | Tragic 13.8% |
| Immigrants | Barbados | 0.0 /100 | #287 | Tragic 13.8% |
Demographics Similar to Immigrants from Korea by Male Poverty
In terms of male poverty, the demographic groups most similar to Immigrants from Korea are Greek (9.7%, a difference of 0.040%), Danish (9.7%, a difference of 0.080%), Polish (9.7%, a difference of 0.12%), Tongan (9.7%, a difference of 0.14%), and Burmese (9.7%, a difference of 0.21%).
| Demographics | Rating | Rank | Male Poverty |
| Immigrants | Scotland | 99.7 /100 | #21 | Exceptional 9.6% |
| Croatians | 99.7 /100 | #22 | Exceptional 9.6% |
| Italians | 99.7 /100 | #23 | Exceptional 9.6% |
| Swedes | 99.7 /100 | #24 | Exceptional 9.6% |
| Eastern Europeans | 99.6 /100 | #25 | Exceptional 9.6% |
| Burmese | 99.6 /100 | #26 | Exceptional 9.7% |
| Danes | 99.6 /100 | #27 | Exceptional 9.7% |
| Immigrants | Korea | 99.6 /100 | #28 | Exceptional 9.7% |
| Greeks | 99.6 /100 | #29 | Exceptional 9.7% |
| Poles | 99.5 /100 | #30 | Exceptional 9.7% |
| Tongans | 99.5 /100 | #31 | Exceptional 9.7% |
| Macedonians | 99.5 /100 | #32 | Exceptional 9.7% |
| Immigrants | Northern Europe | 99.5 /100 | #33 | Exceptional 9.7% |
| Immigrants | Poland | 99.5 /100 | #34 | Exceptional 9.8% |
| Iranians | 99.4 /100 | #35 | Exceptional 9.8% |