Mexican vs Spanish American Indian Male Poverty
COMPARE
Mexican
Spanish American Indian
Male Poverty
Male Poverty Comparison
Mexicans
Spanish American Indians
13.7%
MALE POVERTY
0.0/ 100
METRIC RATING
280th/ 347
METRIC RANK
13.1%
MALE POVERTY
0.1/ 100
METRIC RATING
262nd/ 347
METRIC RANK
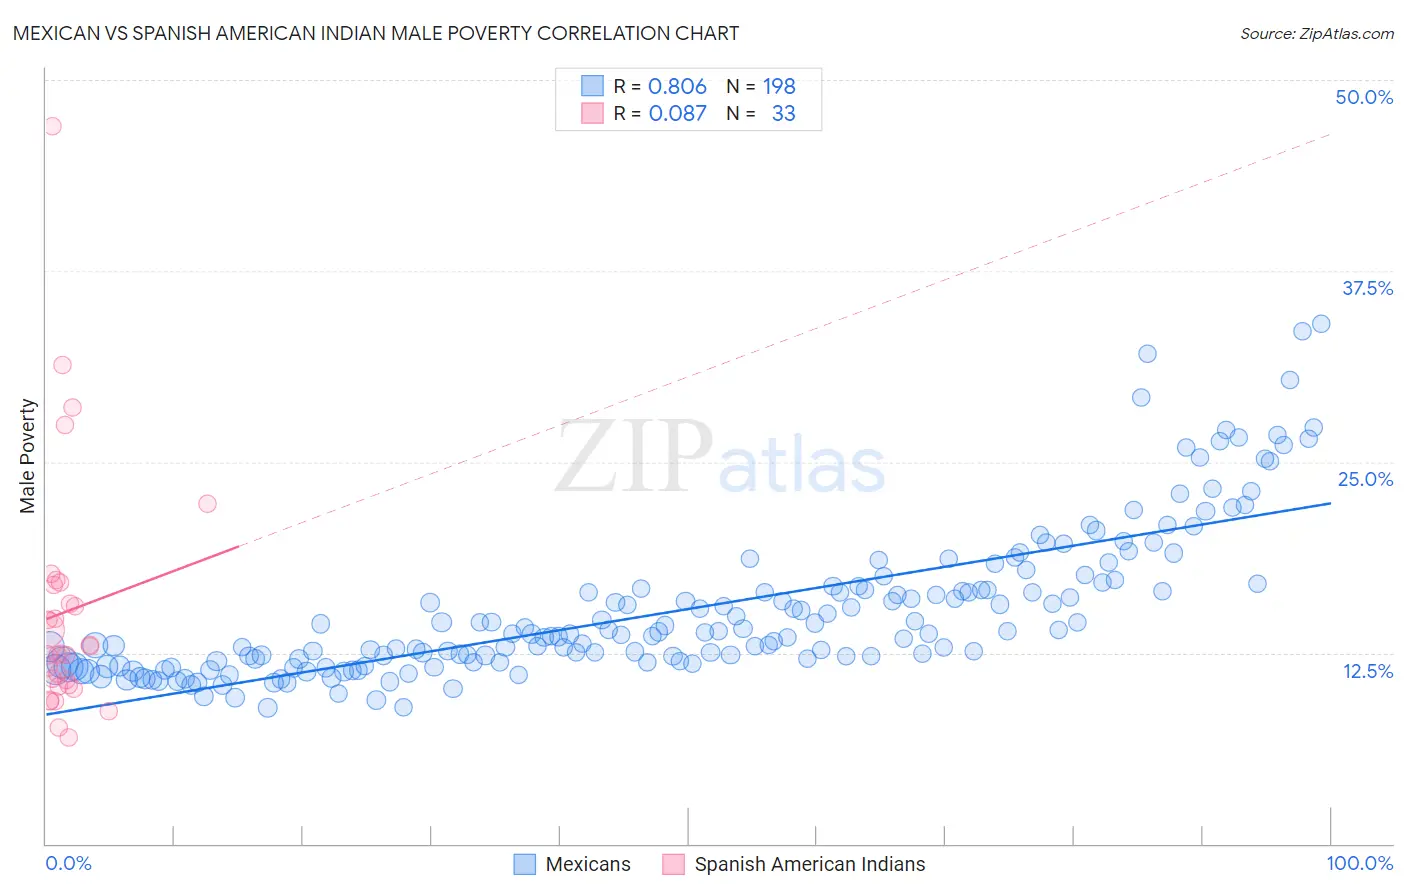
Mexican vs Spanish American Indian Male Poverty Correlation Chart
The statistical analysis conducted on geographies consisting of 563,818,602 people shows a very strong positive correlation between the proportion of Mexicans and poverty level among males in the United States with a correlation coefficient (R) of 0.806 and weighted average of 13.7%. Similarly, the statistical analysis conducted on geographies consisting of 73,141,857 people shows a slight positive correlation between the proportion of Spanish American Indians and poverty level among males in the United States with a correlation coefficient (R) of 0.087 and weighted average of 13.1%, a difference of 4.3%.
Male Poverty Correlation Summary
| Measurement | Mexican | Spanish American Indian |
| Minimum | 8.9% | 6.9% |
| Maximum | 34.1% | 47.0% |
| Range | 25.2% | 40.0% |
| Mean | 15.3% | 15.2% |
| Median | 13.7% | 12.4% |
| Interquartile 25% (IQ1) | 11.9% | 10.4% |
| Interquartile 75% (IQ3) | 16.7% | 17.0% |
| Interquartile Range (IQR) | 4.8% | 6.6% |
| Standard Deviation (Sample) | 4.9% | 8.1% |
| Standard Deviation (Population) | 4.9% | 8.0% |
Demographics Similar to Mexicans and Spanish American Indians by Male Poverty
In terms of male poverty, the demographic groups most similar to Mexicans are Yaqui (13.7%, a difference of 0.050%), Haitian (13.7%, a difference of 0.090%), Belizean (13.6%, a difference of 0.27%), Bangladeshi (13.6%, a difference of 0.37%), and Immigrants from Latin America (13.6%, a difference of 0.52%). Similarly, the demographic groups most similar to Spanish American Indians are Trinidadian and Tobagonian (13.1%, a difference of 0.050%), Central American (13.2%, a difference of 0.40%), Iroquois (13.2%, a difference of 0.76%), Jamaican (13.2%, a difference of 0.78%), and Immigrants from Guyana (13.2%, a difference of 0.92%).
| Demographics | Rating | Rank | Male Poverty |
| Trinidadians and Tobagonians | 0.1 /100 | #261 | Tragic 13.1% |
| Spanish American Indians | 0.1 /100 | #262 | Tragic 13.1% |
| Central Americans | 0.1 /100 | #263 | Tragic 13.2% |
| Iroquois | 0.1 /100 | #264 | Tragic 13.2% |
| Jamaicans | 0.1 /100 | #265 | Tragic 13.2% |
| Immigrants | Guyana | 0.1 /100 | #266 | Tragic 13.2% |
| Immigrants | Jamaica | 0.1 /100 | #267 | Tragic 13.3% |
| Sub-Saharan Africans | 0.1 /100 | #268 | Tragic 13.3% |
| Guyanese | 0.0 /100 | #269 | Tragic 13.3% |
| Cree | 0.0 /100 | #270 | Tragic 13.3% |
| Spanish Americans | 0.0 /100 | #271 | Tragic 13.4% |
| Immigrants | Bahamas | 0.0 /100 | #272 | Tragic 13.5% |
| Chickasaw | 0.0 /100 | #273 | Tragic 13.5% |
| Immigrants | West Indies | 0.0 /100 | #274 | Tragic 13.5% |
| Barbadians | 0.0 /100 | #275 | Tragic 13.6% |
| Immigrants | Latin America | 0.0 /100 | #276 | Tragic 13.6% |
| Bangladeshis | 0.0 /100 | #277 | Tragic 13.6% |
| Belizeans | 0.0 /100 | #278 | Tragic 13.6% |
| Haitians | 0.0 /100 | #279 | Tragic 13.7% |
| Mexicans | 0.0 /100 | #280 | Tragic 13.7% |
| Yaqui | 0.0 /100 | #281 | Tragic 13.7% |