Menominee vs Dominican 7th Grade
COMPARE
Menominee
Dominican
7th Grade
7th Grade Comparison
Menominee
Dominicans
96.7%
7TH GRADE
98.7/ 100
METRIC RATING
99th/ 347
METRIC RANK
93.3%
7TH GRADE
0.0/ 100
METRIC RATING
324th/ 347
METRIC RANK
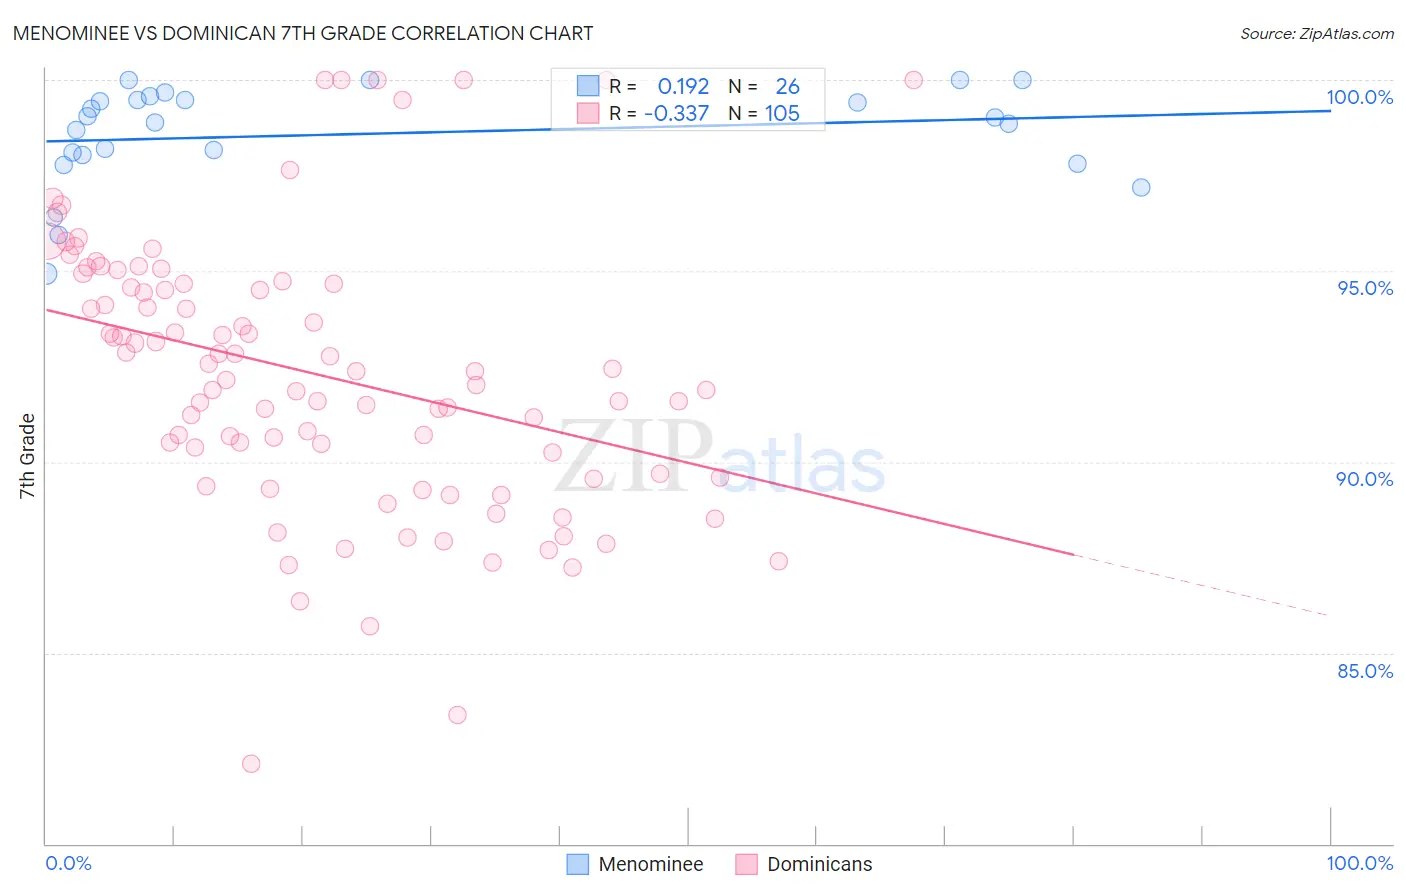
Menominee vs Dominican 7th Grade Correlation Chart
The statistical analysis conducted on geographies consisting of 45,778,979 people shows a poor positive correlation between the proportion of Menominee and percentage of population with at least 7th grade education in the United States with a correlation coefficient (R) of 0.192 and weighted average of 96.7%. Similarly, the statistical analysis conducted on geographies consisting of 355,142,603 people shows a mild negative correlation between the proportion of Dominicans and percentage of population with at least 7th grade education in the United States with a correlation coefficient (R) of -0.337 and weighted average of 93.3%, a difference of 3.6%.
7th Grade Correlation Summary
| Measurement | Menominee | Dominican |
| Minimum | 94.9% | 82.1% |
| Maximum | 100.0% | 100.0% |
| Range | 5.1% | 17.9% |
| Mean | 98.6% | 92.3% |
| Median | 98.9% | 92.4% |
| Interquartile 25% (IQ1) | 98.0% | 89.6% |
| Interquartile 75% (IQ3) | 99.5% | 94.7% |
| Interquartile Range (IQR) | 1.4% | 5.0% |
| Standard Deviation (Sample) | 1.3% | 3.6% |
| Standard Deviation (Population) | 1.3% | 3.6% |
Similar Demographics by 7th Grade
Demographics Similar to Menominee by 7th Grade
In terms of 7th grade, the demographic groups most similar to Menominee are Immigrants from Denmark (96.7%, a difference of 0.0%), Immigrants from Germany (96.7%, a difference of 0.0%), Immigrants from Sweden (96.7%, a difference of 0.0%), German Russian (96.7%, a difference of 0.0%), and Thai (96.7%, a difference of 0.010%).
| Demographics | Rating | Rank | 7th Grade |
| Immigrants | Western Europe | 98.9 /100 | #92 | Exceptional 96.7% |
| Potawatomi | 98.9 /100 | #93 | Exceptional 96.7% |
| Lebanese | 98.8 /100 | #94 | Exceptional 96.7% |
| Immigrants | Australia | 98.8 /100 | #95 | Exceptional 96.7% |
| Immigrants | Denmark | 98.7 /100 | #96 | Exceptional 96.7% |
| Immigrants | Germany | 98.7 /100 | #97 | Exceptional 96.7% |
| Immigrants | Sweden | 98.7 /100 | #98 | Exceptional 96.7% |
| Menominee | 98.7 /100 | #99 | Exceptional 96.7% |
| German Russians | 98.6 /100 | #100 | Exceptional 96.7% |
| Thais | 98.6 /100 | #101 | Exceptional 96.7% |
| Immigrants | Czechoslovakia | 98.3 /100 | #102 | Exceptional 96.6% |
| Immigrants | Singapore | 98.3 /100 | #103 | Exceptional 96.6% |
| Shoshone | 98.1 /100 | #104 | Exceptional 96.6% |
| South Africans | 98.0 /100 | #105 | Exceptional 96.6% |
| Iroquois | 97.9 /100 | #106 | Exceptional 96.6% |
Demographics Similar to Dominicans by 7th Grade
In terms of 7th grade, the demographic groups most similar to Dominicans are Immigrants from Belize (93.4%, a difference of 0.020%), Central American Indian (93.3%, a difference of 0.070%), Nicaraguan (93.5%, a difference of 0.13%), Belizean (93.5%, a difference of 0.16%), and Nepalese (93.2%, a difference of 0.18%).
| Demographics | Rating | Rank | 7th Grade |
| Immigrants | Cuba | 0.0 /100 | #317 | Tragic 93.8% |
| Immigrants | Ecuador | 0.0 /100 | #318 | Tragic 93.7% |
| Immigrants | Cambodia | 0.0 /100 | #319 | Tragic 93.7% |
| Immigrants | Fiji | 0.0 /100 | #320 | Tragic 93.5% |
| Belizeans | 0.0 /100 | #321 | Tragic 93.5% |
| Nicaraguans | 0.0 /100 | #322 | Tragic 93.5% |
| Immigrants | Belize | 0.0 /100 | #323 | Tragic 93.4% |
| Dominicans | 0.0 /100 | #324 | Tragic 93.3% |
| Central American Indians | 0.0 /100 | #325 | Tragic 93.3% |
| Nepalese | 0.0 /100 | #326 | Tragic 93.2% |
| Immigrants | Cabo Verde | 0.0 /100 | #327 | Tragic 93.1% |
| Immigrants | Nicaragua | 0.0 /100 | #328 | Tragic 93.0% |
| Immigrants | Azores | 0.0 /100 | #329 | Tragic 93.0% |
| Immigrants | Dominican Republic | 0.0 /100 | #330 | Tragic 92.9% |
| Hondurans | 0.0 /100 | #331 | Tragic 92.9% |