Marshallese vs Arapaho Female Poverty Among 18-24 Year Olds
COMPARE
Marshallese
Arapaho
Female Poverty Among 18-24 Year Olds
Female Poverty Among 18-24 Year Olds Comparison
Marshallese
Arapaho
20.9%
FEMALE POVERTY AMONG 18-24 YEAR OLDS
3.4/ 100
METRIC RATING
243rd/ 347
METRIC RANK
25.2%
FEMALE POVERTY AMONG 18-24 YEAR OLDS
0.0/ 100
METRIC RATING
323rd/ 347
METRIC RANK
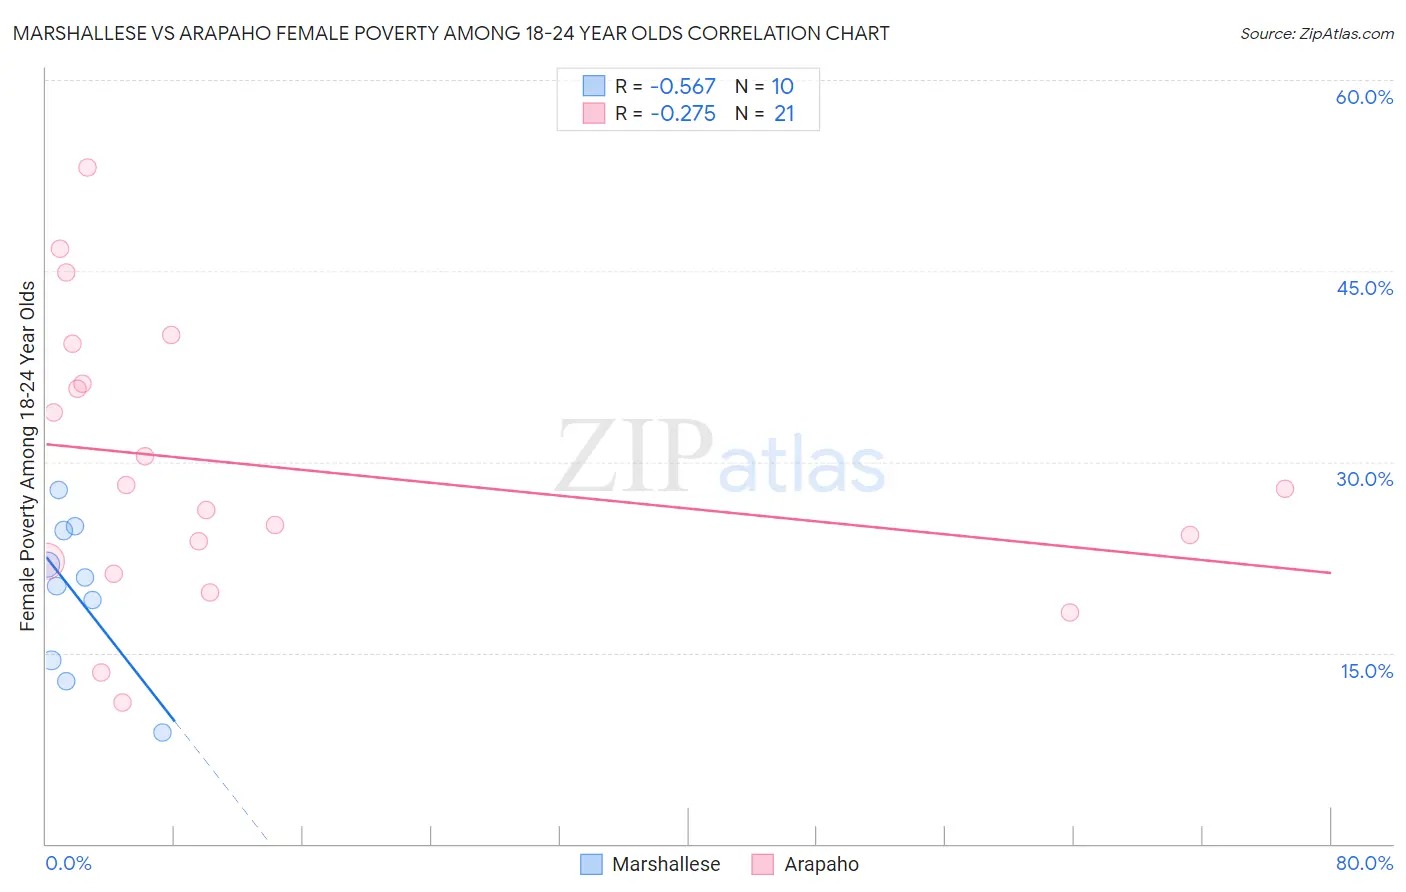
Marshallese vs Arapaho Female Poverty Among 18-24 Year Olds Correlation Chart
The statistical analysis conducted on geographies consisting of 14,709,952 people shows a substantial negative correlation between the proportion of Marshallese and poverty level among females between the ages 18 and 24 in the United States with a correlation coefficient (R) of -0.567 and weighted average of 20.9%. Similarly, the statistical analysis conducted on geographies consisting of 29,593,135 people shows a weak negative correlation between the proportion of Arapaho and poverty level among females between the ages 18 and 24 in the United States with a correlation coefficient (R) of -0.275 and weighted average of 25.2%, a difference of 20.3%.
Female Poverty Among 18-24 Year Olds Correlation Summary
| Measurement | Marshallese | Arapaho |
| Minimum | 8.7% | 11.1% |
| Maximum | 27.8% | 53.1% |
| Range | 19.1% | 42.0% |
| Mean | 19.5% | 29.6% |
| Median | 20.6% | 27.8% |
| Interquartile 25% (IQ1) | 14.4% | 21.7% |
| Interquartile 75% (IQ3) | 24.6% | 37.7% |
| Interquartile Range (IQR) | 10.2% | 16.0% |
| Standard Deviation (Sample) | 6.0% | 11.0% |
| Standard Deviation (Population) | 5.7% | 10.8% |
Similar Demographics by Female Poverty Among 18-24 Year Olds
Demographics Similar to Marshallese by Female Poverty Among 18-24 Year Olds
In terms of female poverty among 18-24 year olds, the demographic groups most similar to Marshallese are Immigrants from Thailand (20.9%, a difference of 0.010%), Aleut (20.9%, a difference of 0.040%), Immigrants from Australia (20.9%, a difference of 0.12%), Immigrants from Africa (21.0%, a difference of 0.18%), and Israeli (20.9%, a difference of 0.23%).
| Demographics | Rating | Rank | Female Poverty Among 18-24 Year Olds |
| Okinawans | 4.9 /100 | #236 | Tragic 20.8% |
| Scottish | 4.5 /100 | #237 | Tragic 20.9% |
| Immigrants | Singapore | 4.4 /100 | #238 | Tragic 20.9% |
| Immigrants | Guatemala | 4.3 /100 | #239 | Tragic 20.9% |
| Luxembourgers | 4.2 /100 | #240 | Tragic 20.9% |
| Immigrants | Eritrea | 4.2 /100 | #241 | Tragic 20.9% |
| Israelis | 4.1 /100 | #242 | Tragic 20.9% |
| Marshallese | 3.4 /100 | #243 | Tragic 20.9% |
| Immigrants | Thailand | 3.4 /100 | #244 | Tragic 20.9% |
| Aleuts | 3.3 /100 | #245 | Tragic 20.9% |
| Immigrants | Australia | 3.1 /100 | #246 | Tragic 20.9% |
| Immigrants | Africa | 3.0 /100 | #247 | Tragic 21.0% |
| Immigrants | Kenya | 2.5 /100 | #248 | Tragic 21.0% |
| Carpatho Rusyns | 2.5 /100 | #249 | Tragic 21.0% |
| Immigrants | West Indies | 2.2 /100 | #250 | Tragic 21.0% |
Demographics Similar to Arapaho by Female Poverty Among 18-24 Year Olds
In terms of female poverty among 18-24 year olds, the demographic groups most similar to Arapaho are German Russian (25.2%, a difference of 0.030%), Somali (25.1%, a difference of 0.070%), Immigrants from Zaire (25.1%, a difference of 0.37%), Immigrants from Saudi Arabia (25.3%, a difference of 0.46%), and Yakama (25.3%, a difference of 0.71%).
| Demographics | Rating | Rank | Female Poverty Among 18-24 Year Olds |
| Alsatians | 0.0 /100 | #316 | Tragic 24.4% |
| Osage | 0.0 /100 | #317 | Tragic 24.5% |
| Chickasaw | 0.0 /100 | #318 | Tragic 24.5% |
| Dutch West Indians | 0.0 /100 | #319 | Tragic 24.5% |
| Immigrants | Congo | 0.0 /100 | #320 | Tragic 24.6% |
| Immigrants | Zaire | 0.0 /100 | #321 | Tragic 25.1% |
| Somalis | 0.0 /100 | #322 | Tragic 25.1% |
| Arapaho | 0.0 /100 | #323 | Tragic 25.2% |
| German Russians | 0.0 /100 | #324 | Tragic 25.2% |
| Immigrants | Saudi Arabia | 0.0 /100 | #325 | Tragic 25.3% |
| Yakama | 0.0 /100 | #326 | Tragic 25.3% |
| Ute | 0.0 /100 | #327 | Tragic 25.4% |
| Natives/Alaskans | 0.0 /100 | #328 | Tragic 25.4% |
| Cajuns | 0.0 /100 | #329 | Tragic 25.7% |
| Immigrants | Somalia | 0.0 /100 | #330 | Tragic 25.7% |