Ecuadorian vs Immigrants from Eritrea Female Poverty Among 18-24 Year Olds
COMPARE
Ecuadorian
Immigrants from Eritrea
Female Poverty Among 18-24 Year Olds
Female Poverty Among 18-24 Year Olds Comparison
Ecuadorians
Immigrants from Eritrea
19.1%
FEMALE POVERTY AMONG 18-24 YEAR OLDS
98.1/ 100
METRIC RATING
101st/ 347
METRIC RANK
20.9%
FEMALE POVERTY AMONG 18-24 YEAR OLDS
4.2/ 100
METRIC RATING
241st/ 347
METRIC RANK
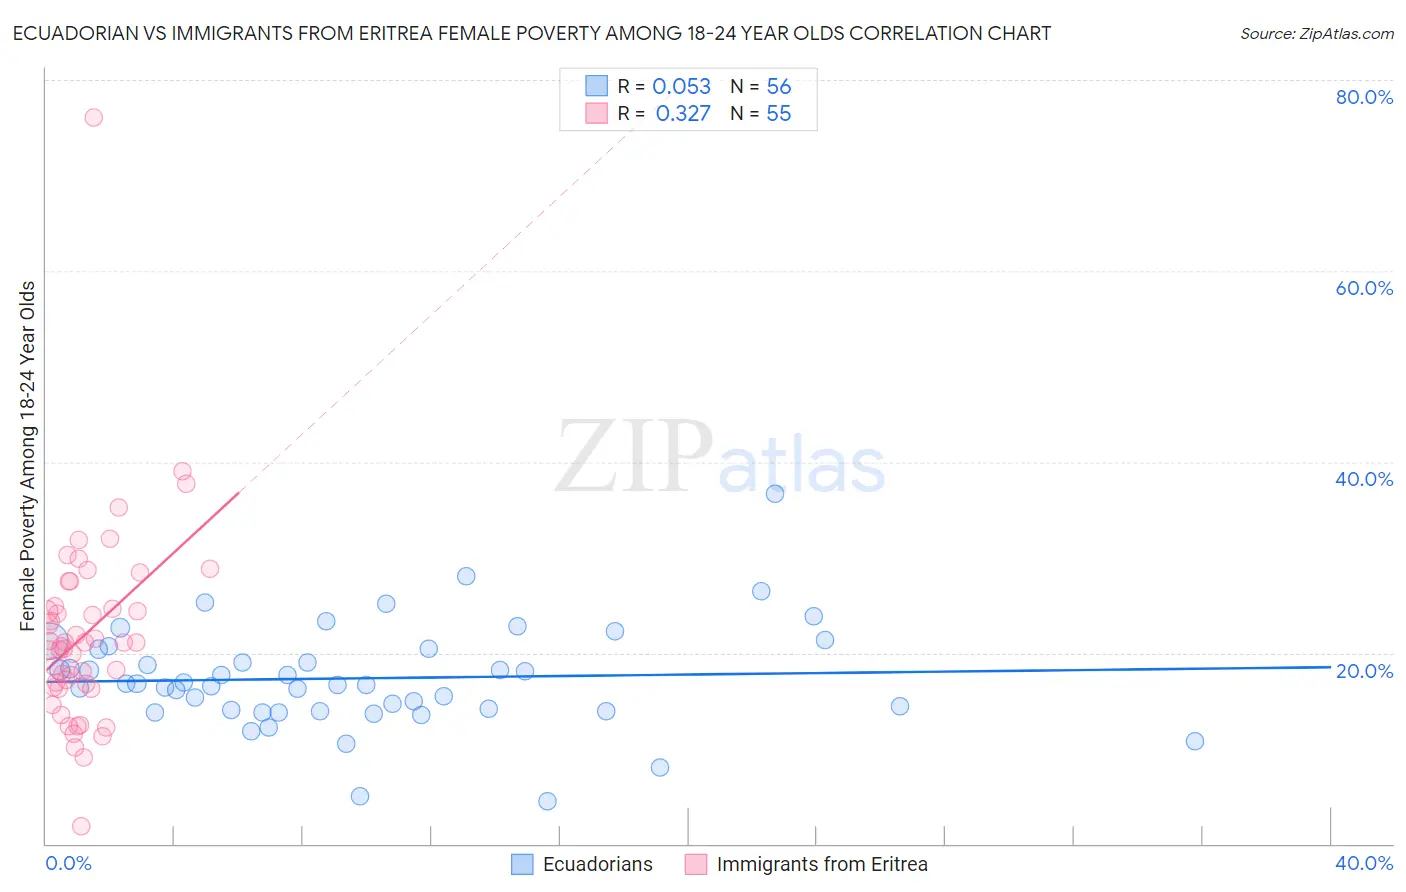
Ecuadorian vs Immigrants from Eritrea Female Poverty Among 18-24 Year Olds Correlation Chart
The statistical analysis conducted on geographies consisting of 311,495,994 people shows a slight positive correlation between the proportion of Ecuadorians and poverty level among females between the ages 18 and 24 in the United States with a correlation coefficient (R) of 0.053 and weighted average of 19.1%. Similarly, the statistical analysis conducted on geographies consisting of 104,465,492 people shows a mild positive correlation between the proportion of Immigrants from Eritrea and poverty level among females between the ages 18 and 24 in the United States with a correlation coefficient (R) of 0.327 and weighted average of 20.9%, a difference of 9.1%.
Female Poverty Among 18-24 Year Olds Correlation Summary
| Measurement | Ecuadorian | Immigrants from Eritrea |
| Minimum | 4.4% | 1.8% |
| Maximum | 36.6% | 76.0% |
| Range | 32.2% | 74.2% |
| Mean | 17.3% | 21.9% |
| Median | 16.7% | 21.0% |
| Interquartile 25% (IQ1) | 14.0% | 16.4% |
| Interquartile 75% (IQ3) | 20.4% | 24.9% |
| Interquartile Range (IQR) | 6.4% | 8.5% |
| Standard Deviation (Sample) | 5.4% | 10.5% |
| Standard Deviation (Population) | 5.4% | 10.4% |
Similar Demographics by Female Poverty Among 18-24 Year Olds
Demographics Similar to Ecuadorians by Female Poverty Among 18-24 Year Olds
In terms of female poverty among 18-24 year olds, the demographic groups most similar to Ecuadorians are Immigrants from Caribbean (19.1%, a difference of 0.020%), Serbian (19.1%, a difference of 0.070%), Chilean (19.1%, a difference of 0.090%), Immigrants from Czechoslovakia (19.1%, a difference of 0.11%), and Immigrants from Afghanistan (19.1%, a difference of 0.11%).
| Demographics | Rating | Rank | Female Poverty Among 18-24 Year Olds |
| Ukrainians | 98.8 /100 | #94 | Exceptional 19.0% |
| Guamanians/Chamorros | 98.8 /100 | #95 | Exceptional 19.0% |
| Sierra Leoneans | 98.7 /100 | #96 | Exceptional 19.0% |
| Salvadorans | 98.4 /100 | #97 | Exceptional 19.1% |
| Immigrants | Jordan | 98.4 /100 | #98 | Exceptional 19.1% |
| Immigrants | Czechoslovakia | 98.3 /100 | #99 | Exceptional 19.1% |
| Chileans | 98.3 /100 | #100 | Exceptional 19.1% |
| Ecuadorians | 98.1 /100 | #101 | Exceptional 19.1% |
| Immigrants | Caribbean | 98.1 /100 | #102 | Exceptional 19.1% |
| Serbians | 98.0 /100 | #103 | Exceptional 19.1% |
| Immigrants | Afghanistan | 98.0 /100 | #104 | Exceptional 19.1% |
| Immigrants | Ecuador | 97.8 /100 | #105 | Exceptional 19.2% |
| Immigrants | Sierra Leone | 97.8 /100 | #106 | Exceptional 19.2% |
| Immigrants | Sri Lanka | 97.5 /100 | #107 | Exceptional 19.2% |
| Immigrants | Uzbekistan | 97.3 /100 | #108 | Exceptional 19.2% |
Demographics Similar to Immigrants from Eritrea by Female Poverty Among 18-24 Year Olds
In terms of female poverty among 18-24 year olds, the demographic groups most similar to Immigrants from Eritrea are Israeli (20.9%, a difference of 0.010%), Luxembourger (20.9%, a difference of 0.020%), Immigrants from Guatemala (20.9%, a difference of 0.040%), Immigrants from Singapore (20.9%, a difference of 0.050%), and Scottish (20.9%, a difference of 0.090%).
| Demographics | Rating | Rank | Female Poverty Among 18-24 Year Olds |
| Welsh | 5.4 /100 | #234 | Tragic 20.8% |
| Immigrants | Uganda | 5.1 /100 | #235 | Tragic 20.8% |
| Okinawans | 4.9 /100 | #236 | Tragic 20.8% |
| Scottish | 4.5 /100 | #237 | Tragic 20.9% |
| Immigrants | Singapore | 4.4 /100 | #238 | Tragic 20.9% |
| Immigrants | Guatemala | 4.3 /100 | #239 | Tragic 20.9% |
| Luxembourgers | 4.2 /100 | #240 | Tragic 20.9% |
| Immigrants | Eritrea | 4.2 /100 | #241 | Tragic 20.9% |
| Israelis | 4.1 /100 | #242 | Tragic 20.9% |
| Marshallese | 3.4 /100 | #243 | Tragic 20.9% |
| Immigrants | Thailand | 3.4 /100 | #244 | Tragic 20.9% |
| Aleuts | 3.3 /100 | #245 | Tragic 20.9% |
| Immigrants | Australia | 3.1 /100 | #246 | Tragic 20.9% |
| Immigrants | Africa | 3.0 /100 | #247 | Tragic 21.0% |
| Immigrants | Kenya | 2.5 /100 | #248 | Tragic 21.0% |