Immigrants from Nigeria vs Immigrants from Eritrea Female Poverty Among 18-24 Year Olds
COMPARE
Immigrants from Nigeria
Immigrants from Eritrea
Female Poverty Among 18-24 Year Olds
Female Poverty Among 18-24 Year Olds Comparison
Immigrants from Nigeria
Immigrants from Eritrea
20.1%
FEMALE POVERTY AMONG 18-24 YEAR OLDS
54.3/ 100
METRIC RATING
171st/ 347
METRIC RANK
20.9%
FEMALE POVERTY AMONG 18-24 YEAR OLDS
4.2/ 100
METRIC RATING
241st/ 347
METRIC RANK
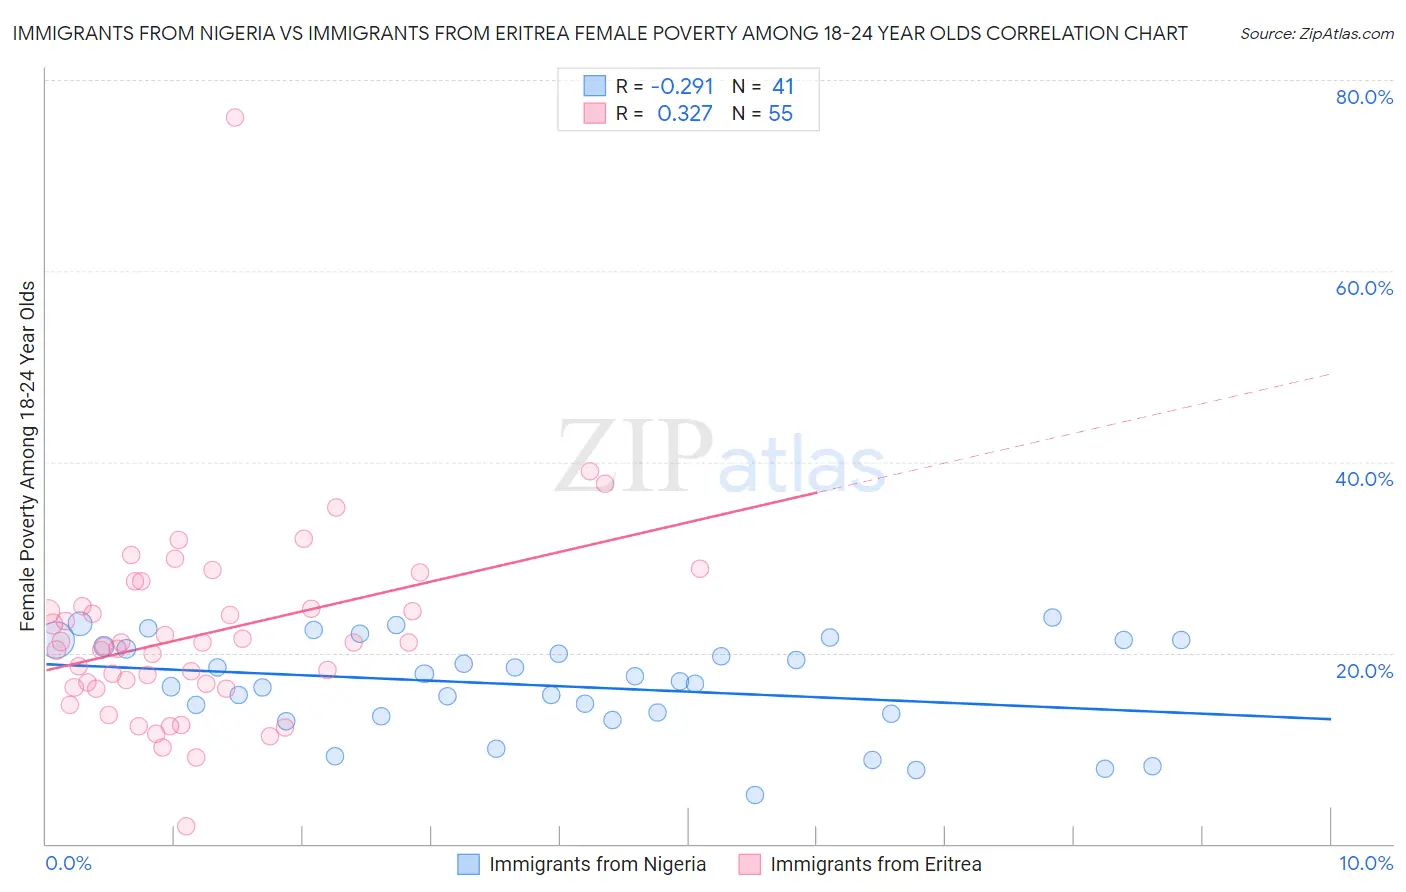
Immigrants from Nigeria vs Immigrants from Eritrea Female Poverty Among 18-24 Year Olds Correlation Chart
The statistical analysis conducted on geographies consisting of 279,729,730 people shows a weak negative correlation between the proportion of Immigrants from Nigeria and poverty level among females between the ages 18 and 24 in the United States with a correlation coefficient (R) of -0.291 and weighted average of 20.1%. Similarly, the statistical analysis conducted on geographies consisting of 104,465,492 people shows a mild positive correlation between the proportion of Immigrants from Eritrea and poverty level among females between the ages 18 and 24 in the United States with a correlation coefficient (R) of 0.327 and weighted average of 20.9%, a difference of 4.1%.
Female Poverty Among 18-24 Year Olds Correlation Summary
| Measurement | Immigrants from Nigeria | Immigrants from Eritrea |
| Minimum | 5.1% | 1.8% |
| Maximum | 23.7% | 76.0% |
| Range | 18.6% | 74.2% |
| Mean | 16.6% | 21.9% |
| Median | 17.1% | 21.0% |
| Interquartile 25% (IQ1) | 13.5% | 16.4% |
| Interquartile 75% (IQ3) | 21.0% | 24.9% |
| Interquartile Range (IQR) | 7.5% | 8.5% |
| Standard Deviation (Sample) | 5.0% | 10.5% |
| Standard Deviation (Population) | 4.9% | 10.4% |
Similar Demographics by Female Poverty Among 18-24 Year Olds
Demographics Similar to Immigrants from Nigeria by Female Poverty Among 18-24 Year Olds
In terms of female poverty among 18-24 year olds, the demographic groups most similar to Immigrants from Nigeria are Iranian (20.1%, a difference of 0.020%), Hmong (20.0%, a difference of 0.060%), Belizean (20.1%, a difference of 0.11%), Irish (20.1%, a difference of 0.21%), and Swedish (20.1%, a difference of 0.21%).
| Demographics | Rating | Rank | Female Poverty Among 18-24 Year Olds |
| Central Americans | 70.0 /100 | #164 | Good 19.9% |
| Eastern Europeans | 69.3 /100 | #165 | Good 19.9% |
| Belgians | 69.1 /100 | #166 | Good 19.9% |
| Czechoslovakians | 61.8 /100 | #167 | Good 20.0% |
| Fijians | 59.1 /100 | #168 | Average 20.0% |
| Hmong | 55.4 /100 | #169 | Average 20.0% |
| Iranians | 54.7 /100 | #170 | Average 20.1% |
| Immigrants | Nigeria | 54.3 /100 | #171 | Average 20.1% |
| Belizeans | 52.0 /100 | #172 | Average 20.1% |
| Irish | 50.0 /100 | #173 | Average 20.1% |
| Swedes | 50.0 /100 | #174 | Average 20.1% |
| South American Indians | 48.4 /100 | #175 | Average 20.1% |
| Kenyans | 44.9 /100 | #176 | Average 20.2% |
| Immigrants | Kazakhstan | 44.2 /100 | #177 | Average 20.2% |
| Swiss | 44.0 /100 | #178 | Average 20.2% |
Demographics Similar to Immigrants from Eritrea by Female Poverty Among 18-24 Year Olds
In terms of female poverty among 18-24 year olds, the demographic groups most similar to Immigrants from Eritrea are Israeli (20.9%, a difference of 0.010%), Luxembourger (20.9%, a difference of 0.020%), Immigrants from Guatemala (20.9%, a difference of 0.040%), Immigrants from Singapore (20.9%, a difference of 0.050%), and Scottish (20.9%, a difference of 0.090%).
| Demographics | Rating | Rank | Female Poverty Among 18-24 Year Olds |
| Welsh | 5.4 /100 | #234 | Tragic 20.8% |
| Immigrants | Uganda | 5.1 /100 | #235 | Tragic 20.8% |
| Okinawans | 4.9 /100 | #236 | Tragic 20.8% |
| Scottish | 4.5 /100 | #237 | Tragic 20.9% |
| Immigrants | Singapore | 4.4 /100 | #238 | Tragic 20.9% |
| Immigrants | Guatemala | 4.3 /100 | #239 | Tragic 20.9% |
| Luxembourgers | 4.2 /100 | #240 | Tragic 20.9% |
| Immigrants | Eritrea | 4.2 /100 | #241 | Tragic 20.9% |
| Israelis | 4.1 /100 | #242 | Tragic 20.9% |
| Marshallese | 3.4 /100 | #243 | Tragic 20.9% |
| Immigrants | Thailand | 3.4 /100 | #244 | Tragic 20.9% |
| Aleuts | 3.3 /100 | #245 | Tragic 20.9% |
| Immigrants | Australia | 3.1 /100 | #246 | Tragic 20.9% |
| Immigrants | Africa | 3.0 /100 | #247 | Tragic 21.0% |
| Immigrants | Kenya | 2.5 /100 | #248 | Tragic 21.0% |