Marshallese vs Immigrants from Bulgaria Single Female Poverty
COMPARE
Marshallese
Immigrants from Bulgaria
Single Female Poverty
Single Female Poverty Comparison
Marshallese
Immigrants from Bulgaria
23.3%
SINGLE FEMALE POVERTY
0.1/ 100
METRIC RATING
274th/ 347
METRIC RANK
19.1%
SINGLE FEMALE POVERTY
99.7/ 100
METRIC RATING
58th/ 347
METRIC RANK
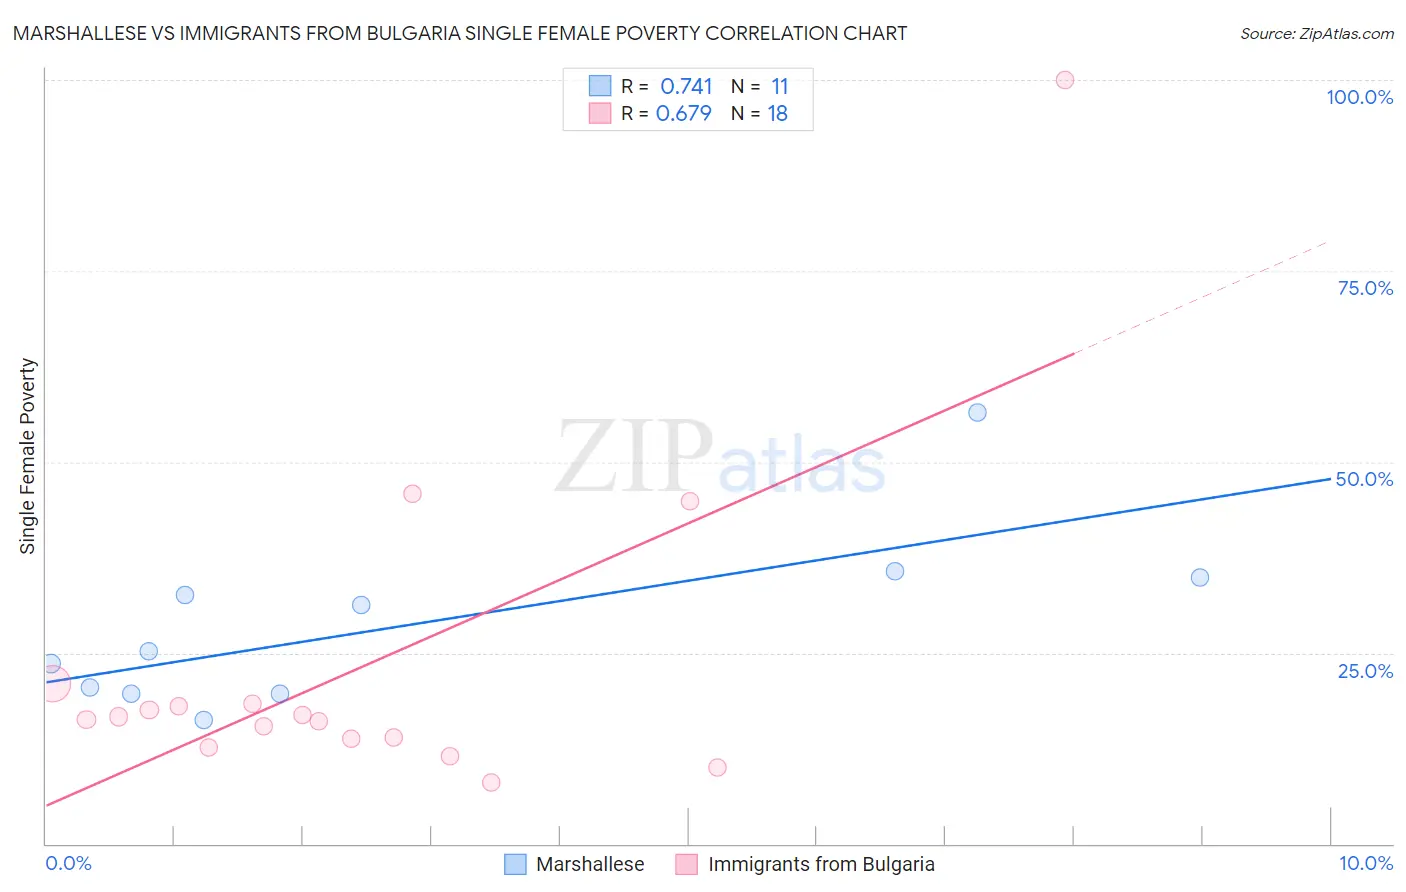
Marshallese vs Immigrants from Bulgaria Single Female Poverty Correlation Chart
The statistical analysis conducted on geographies consisting of 14,727,549 people shows a strong positive correlation between the proportion of Marshallese and poverty level among single females in the United States with a correlation coefficient (R) of 0.741 and weighted average of 23.3%. Similarly, the statistical analysis conducted on geographies consisting of 171,131,313 people shows a significant positive correlation between the proportion of Immigrants from Bulgaria and poverty level among single females in the United States with a correlation coefficient (R) of 0.679 and weighted average of 19.1%, a difference of 21.6%.
Single Female Poverty Correlation Summary
| Measurement | Marshallese | Immigrants from Bulgaria |
| Minimum | 16.2% | 8.1% |
| Maximum | 56.5% | 100.0% |
| Range | 40.3% | 91.9% |
| Mean | 28.7% | 23.1% |
| Median | 25.2% | 16.4% |
| Interquartile 25% (IQ1) | 19.6% | 13.7% |
| Interquartile 75% (IQ3) | 34.8% | 18.3% |
| Interquartile Range (IQR) | 15.2% | 4.6% |
| Standard Deviation (Sample) | 11.4% | 21.8% |
| Standard Deviation (Population) | 10.9% | 21.1% |
Similar Demographics by Single Female Poverty
Demographics Similar to Marshallese by Single Female Poverty
In terms of single female poverty, the demographic groups most similar to Marshallese are Alaska Native (23.3%, a difference of 0.010%), Immigrants from Senegal (23.2%, a difference of 0.26%), Mexican American Indian (23.4%, a difference of 0.27%), Subsaharan African (23.2%, a difference of 0.45%), and Inupiat (23.1%, a difference of 0.69%).
| Demographics | Rating | Rank | Single Female Poverty |
| Senegalese | 0.2 /100 | #267 | Tragic 23.0% |
| Fijians | 0.2 /100 | #268 | Tragic 23.1% |
| Hmong | 0.2 /100 | #269 | Tragic 23.1% |
| Inupiat | 0.2 /100 | #270 | Tragic 23.1% |
| Sub-Saharan Africans | 0.1 /100 | #271 | Tragic 23.2% |
| Immigrants | Senegal | 0.1 /100 | #272 | Tragic 23.2% |
| Alaska Natives | 0.1 /100 | #273 | Tragic 23.3% |
| Marshallese | 0.1 /100 | #274 | Tragic 23.3% |
| Mexican American Indians | 0.1 /100 | #275 | Tragic 23.4% |
| Immigrants | Azores | 0.0 /100 | #276 | Tragic 23.5% |
| Pennsylvania Germans | 0.0 /100 | #277 | Tragic 23.6% |
| Immigrants | Nonimmigrants | 0.0 /100 | #278 | Tragic 23.6% |
| Alaskan Athabascans | 0.0 /100 | #279 | Tragic 23.6% |
| Immigrants | Latin America | 0.0 /100 | #280 | Tragic 23.7% |
| Immigrants | Zaire | 0.0 /100 | #281 | Tragic 23.8% |
Demographics Similar to Immigrants from Bulgaria by Single Female Poverty
In terms of single female poverty, the demographic groups most similar to Immigrants from Bulgaria are Sri Lankan (19.2%, a difference of 0.10%), Eastern European (19.1%, a difference of 0.12%), Immigrants from Fiji (19.1%, a difference of 0.18%), Russian (19.2%, a difference of 0.20%), and Cambodian (19.2%, a difference of 0.22%).
| Demographics | Rating | Rank | Single Female Poverty |
| Immigrants | Italy | 99.8 /100 | #51 | Exceptional 19.0% |
| Egyptians | 99.7 /100 | #52 | Exceptional 19.1% |
| Tsimshian | 99.7 /100 | #53 | Exceptional 19.1% |
| Argentineans | 99.7 /100 | #54 | Exceptional 19.1% |
| Immigrants | Vietnam | 99.7 /100 | #55 | Exceptional 19.1% |
| Immigrants | Fiji | 99.7 /100 | #56 | Exceptional 19.1% |
| Eastern Europeans | 99.7 /100 | #57 | Exceptional 19.1% |
| Immigrants | Bulgaria | 99.7 /100 | #58 | Exceptional 19.1% |
| Sri Lankans | 99.6 /100 | #59 | Exceptional 19.2% |
| Russians | 99.6 /100 | #60 | Exceptional 19.2% |
| Cambodians | 99.6 /100 | #61 | Exceptional 19.2% |
| Lithuanians | 99.6 /100 | #62 | Exceptional 19.2% |
| Immigrants | Northern Europe | 99.6 /100 | #63 | Exceptional 19.2% |
| Immigrants | Europe | 99.6 /100 | #64 | Exceptional 19.2% |
| Cypriots | 99.6 /100 | #65 | Exceptional 19.2% |