Malaysian vs Nicaraguan Family Poverty
COMPARE
Malaysian
Nicaraguan
Family Poverty
Family Poverty Comparison
Malaysians
Nicaraguans
9.6%
FAMILY POVERTY
10.6/ 100
METRIC RATING
211th/ 347
METRIC RANK
10.6%
FAMILY POVERTY
0.4/ 100
METRIC RATING
248th/ 347
METRIC RANK
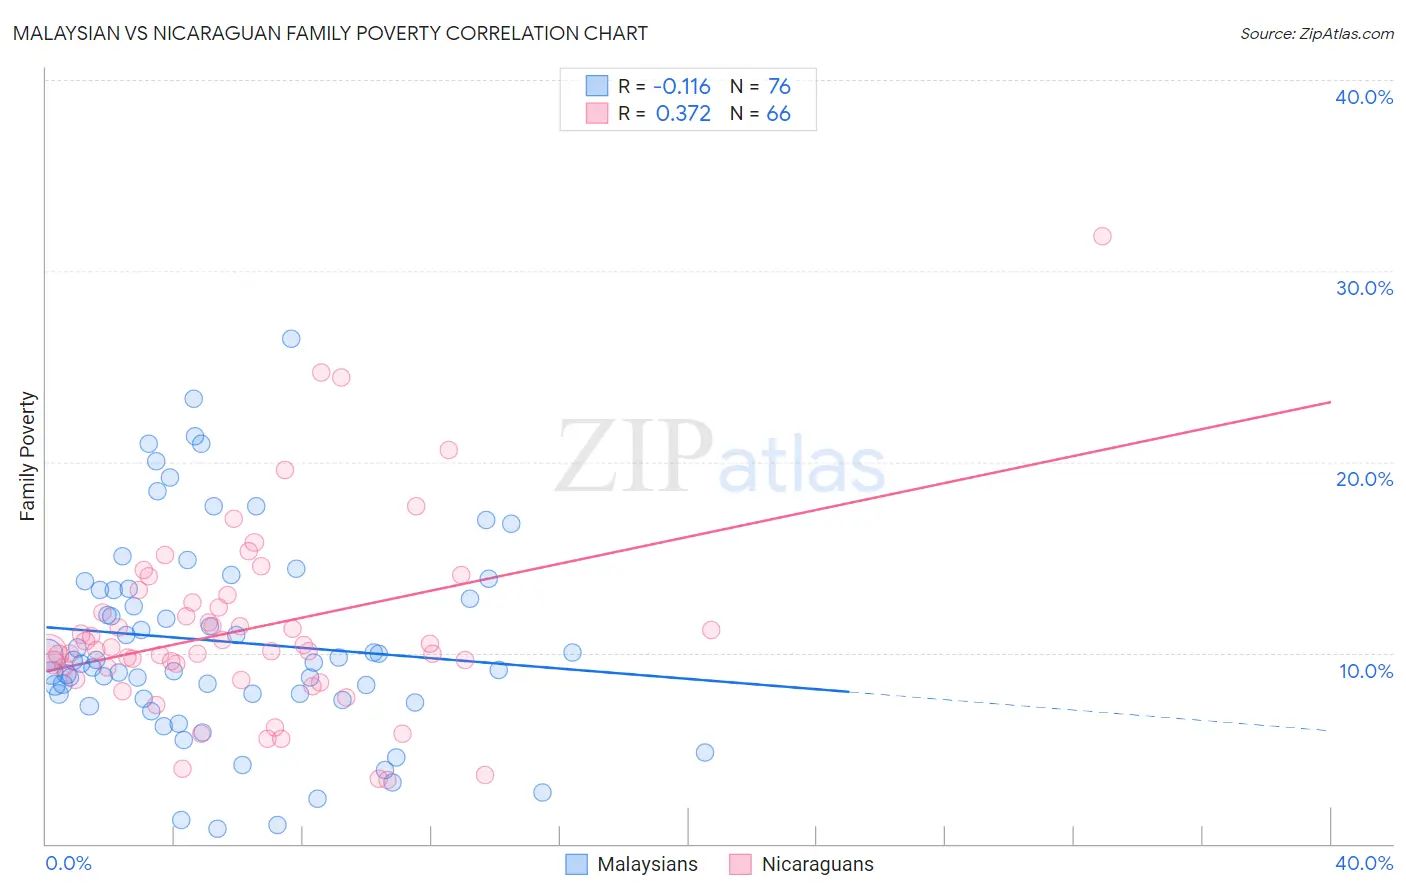
Malaysian vs Nicaraguan Family Poverty Correlation Chart
The statistical analysis conducted on geographies consisting of 225,820,705 people shows a poor negative correlation between the proportion of Malaysians and poverty level among families in the United States with a correlation coefficient (R) of -0.116 and weighted average of 9.6%. Similarly, the statistical analysis conducted on geographies consisting of 285,444,498 people shows a mild positive correlation between the proportion of Nicaraguans and poverty level among families in the United States with a correlation coefficient (R) of 0.372 and weighted average of 10.6%, a difference of 10.3%.
Family Poverty Correlation Summary
| Measurement | Malaysian | Nicaraguan |
| Minimum | 0.81% | 3.3% |
| Maximum | 26.5% | 31.8% |
| Range | 25.6% | 28.5% |
| Mean | 10.6% | 11.2% |
| Median | 9.6% | 10.2% |
| Interquartile 25% (IQ1) | 7.7% | 9.2% |
| Interquartile 75% (IQ3) | 13.3% | 12.6% |
| Interquartile Range (IQR) | 5.6% | 3.4% |
| Standard Deviation (Sample) | 5.3% | 5.0% |
| Standard Deviation (Population) | 5.3% | 4.9% |
Similar Demographics by Family Poverty
Demographics Similar to Malaysians by Family Poverty
In terms of family poverty, the demographic groups most similar to Malaysians are Alsatian (9.6%, a difference of 0.23%), Immigrants from Thailand (9.7%, a difference of 0.30%), Osage (9.7%, a difference of 0.94%), Immigrants from Uruguay (9.5%, a difference of 0.97%), and Immigrants from Eastern Africa (9.5%, a difference of 1.3%).
| Demographics | Rating | Rank | Family Poverty |
| Immigrants | Lebanon | 18.9 /100 | #204 | Poor 9.4% |
| Aleuts | 18.0 /100 | #205 | Poor 9.5% |
| Immigrants | South America | 18.0 /100 | #206 | Poor 9.5% |
| Sierra Leoneans | 15.6 /100 | #207 | Poor 9.5% |
| Immigrants | Eastern Africa | 15.1 /100 | #208 | Poor 9.5% |
| Immigrants | Uruguay | 14.0 /100 | #209 | Poor 9.5% |
| Alsatians | 11.3 /100 | #210 | Poor 9.6% |
| Malaysians | 10.6 /100 | #211 | Poor 9.6% |
| Immigrants | Thailand | 9.7 /100 | #212 | Tragic 9.7% |
| Osage | 8.0 /100 | #213 | Tragic 9.7% |
| Immigrants | Micronesia | 6.7 /100 | #214 | Tragic 9.8% |
| Immigrants | Nonimmigrants | 6.7 /100 | #215 | Tragic 9.8% |
| Moroccans | 6.5 /100 | #216 | Tragic 9.8% |
| Americans | 6.2 /100 | #217 | Tragic 9.8% |
| Panamanians | 5.6 /100 | #218 | Tragic 9.8% |
Demographics Similar to Nicaraguans by Family Poverty
In terms of family poverty, the demographic groups most similar to Nicaraguans are Cuban (10.6%, a difference of 0.050%), Liberian (10.6%, a difference of 0.20%), Cherokee (10.6%, a difference of 0.29%), Salvadoran (10.7%, a difference of 0.57%), and Iroquois (10.7%, a difference of 0.86%).
| Demographics | Rating | Rank | Family Poverty |
| Ghanaians | 1.3 /100 | #241 | Tragic 10.3% |
| Alaska Natives | 1.0 /100 | #242 | Tragic 10.4% |
| Nepalese | 0.8 /100 | #243 | Tragic 10.4% |
| Cree | 0.7 /100 | #244 | Tragic 10.5% |
| Immigrants | Burma/Myanmar | 0.6 /100 | #245 | Tragic 10.5% |
| Cherokee | 0.5 /100 | #246 | Tragic 10.6% |
| Liberians | 0.4 /100 | #247 | Tragic 10.6% |
| Nicaraguans | 0.4 /100 | #248 | Tragic 10.6% |
| Cubans | 0.4 /100 | #249 | Tragic 10.6% |
| Salvadorans | 0.3 /100 | #250 | Tragic 10.7% |
| Iroquois | 0.3 /100 | #251 | Tragic 10.7% |
| Immigrants | Zaire | 0.3 /100 | #252 | Tragic 10.7% |
| Immigrants | Western Africa | 0.3 /100 | #253 | Tragic 10.7% |
| Ecuadorians | 0.2 /100 | #254 | Tragic 10.8% |
| Immigrants | Liberia | 0.2 /100 | #255 | Tragic 10.8% |