Immigrants from Armenia vs Nicaraguan Family Poverty
COMPARE
Immigrants from Armenia
Nicaraguan
Family Poverty
Family Poverty Comparison
Immigrants from Armenia
Nicaraguans
10.0%
FAMILY POVERTY
3.3/ 100
METRIC RATING
227th/ 347
METRIC RANK
10.6%
FAMILY POVERTY
0.4/ 100
METRIC RATING
248th/ 347
METRIC RANK
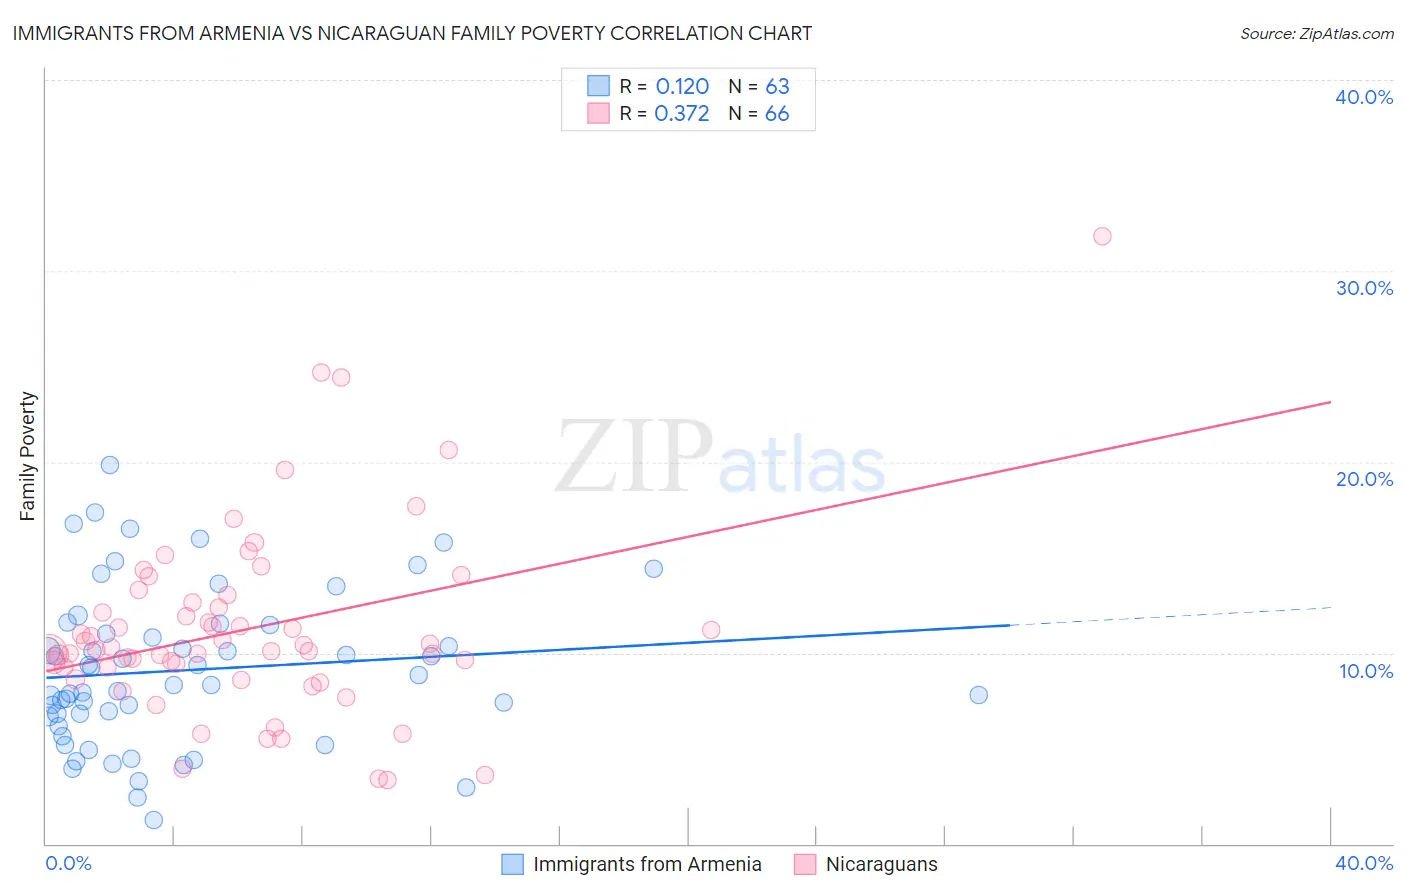
Immigrants from Armenia vs Nicaraguan Family Poverty Correlation Chart
The statistical analysis conducted on geographies consisting of 97,632,131 people shows a poor positive correlation between the proportion of Immigrants from Armenia and poverty level among families in the United States with a correlation coefficient (R) of 0.120 and weighted average of 10.0%. Similarly, the statistical analysis conducted on geographies consisting of 285,444,498 people shows a mild positive correlation between the proportion of Nicaraguans and poverty level among families in the United States with a correlation coefficient (R) of 0.372 and weighted average of 10.6%, a difference of 6.3%.
Family Poverty Correlation Summary
| Measurement | Immigrants from Armenia | Nicaraguan |
| Minimum | 1.2% | 3.3% |
| Maximum | 19.9% | 31.8% |
| Range | 18.6% | 28.5% |
| Mean | 9.1% | 11.2% |
| Median | 8.3% | 10.2% |
| Interquartile 25% (IQ1) | 6.7% | 9.2% |
| Interquartile 75% (IQ3) | 11.5% | 12.6% |
| Interquartile Range (IQR) | 4.8% | 3.4% |
| Standard Deviation (Sample) | 4.1% | 5.0% |
| Standard Deviation (Population) | 4.0% | 4.9% |
Similar Demographics by Family Poverty
Demographics Similar to Immigrants from Armenia by Family Poverty
In terms of family poverty, the demographic groups most similar to Immigrants from Armenia are Ottawa (10.0%, a difference of 0.020%), Sudanese (10.0%, a difference of 0.20%), Immigrants from Uzbekistan (10.0%, a difference of 0.21%), Immigrants from Panama (10.0%, a difference of 0.23%), and Immigrants (10.0%, a difference of 0.29%).
| Demographics | Rating | Rank | Family Poverty |
| Bermudans | 5.3 /100 | #220 | Tragic 9.9% |
| Immigrants | Cambodia | 4.8 /100 | #221 | Tragic 9.9% |
| Japanese | 4.8 /100 | #222 | Tragic 9.9% |
| Immigrants | Africa | 4.3 /100 | #223 | Tragic 9.9% |
| Marshallese | 3.9 /100 | #224 | Tragic 9.9% |
| Immigrants | Immigrants | 3.6 /100 | #225 | Tragic 10.0% |
| Ottawa | 3.3 /100 | #226 | Tragic 10.0% |
| Immigrants | Armenia | 3.3 /100 | #227 | Tragic 10.0% |
| Sudanese | 3.1 /100 | #228 | Tragic 10.0% |
| Immigrants | Uzbekistan | 3.1 /100 | #229 | Tragic 10.0% |
| Immigrants | Panama | 3.1 /100 | #230 | Tragic 10.0% |
| Alaskan Athabascans | 2.7 /100 | #231 | Tragic 10.1% |
| Immigrants | Sudan | 2.3 /100 | #232 | Tragic 10.1% |
| Fijians | 2.1 /100 | #233 | Tragic 10.1% |
| Immigrants | Middle Africa | 2.1 /100 | #234 | Tragic 10.1% |
Demographics Similar to Nicaraguans by Family Poverty
In terms of family poverty, the demographic groups most similar to Nicaraguans are Cuban (10.6%, a difference of 0.050%), Liberian (10.6%, a difference of 0.20%), Cherokee (10.6%, a difference of 0.29%), Salvadoran (10.7%, a difference of 0.57%), and Iroquois (10.7%, a difference of 0.86%).
| Demographics | Rating | Rank | Family Poverty |
| Ghanaians | 1.3 /100 | #241 | Tragic 10.3% |
| Alaska Natives | 1.0 /100 | #242 | Tragic 10.4% |
| Nepalese | 0.8 /100 | #243 | Tragic 10.4% |
| Cree | 0.7 /100 | #244 | Tragic 10.5% |
| Immigrants | Burma/Myanmar | 0.6 /100 | #245 | Tragic 10.5% |
| Cherokee | 0.5 /100 | #246 | Tragic 10.6% |
| Liberians | 0.4 /100 | #247 | Tragic 10.6% |
| Nicaraguans | 0.4 /100 | #248 | Tragic 10.6% |
| Cubans | 0.4 /100 | #249 | Tragic 10.6% |
| Salvadorans | 0.3 /100 | #250 | Tragic 10.7% |
| Iroquois | 0.3 /100 | #251 | Tragic 10.7% |
| Immigrants | Zaire | 0.3 /100 | #252 | Tragic 10.7% |
| Immigrants | Western Africa | 0.3 /100 | #253 | Tragic 10.7% |
| Ecuadorians | 0.2 /100 | #254 | Tragic 10.8% |
| Immigrants | Liberia | 0.2 /100 | #255 | Tragic 10.8% |