Malaysian vs European Family Poverty
COMPARE
Malaysian
European
Family Poverty
Family Poverty Comparison
Malaysians
Europeans
9.6%
FAMILY POVERTY
10.6/ 100
METRIC RATING
211th/ 347
METRIC RANK
7.7%
FAMILY POVERTY
98.7/ 100
METRIC RATING
59th/ 347
METRIC RANK
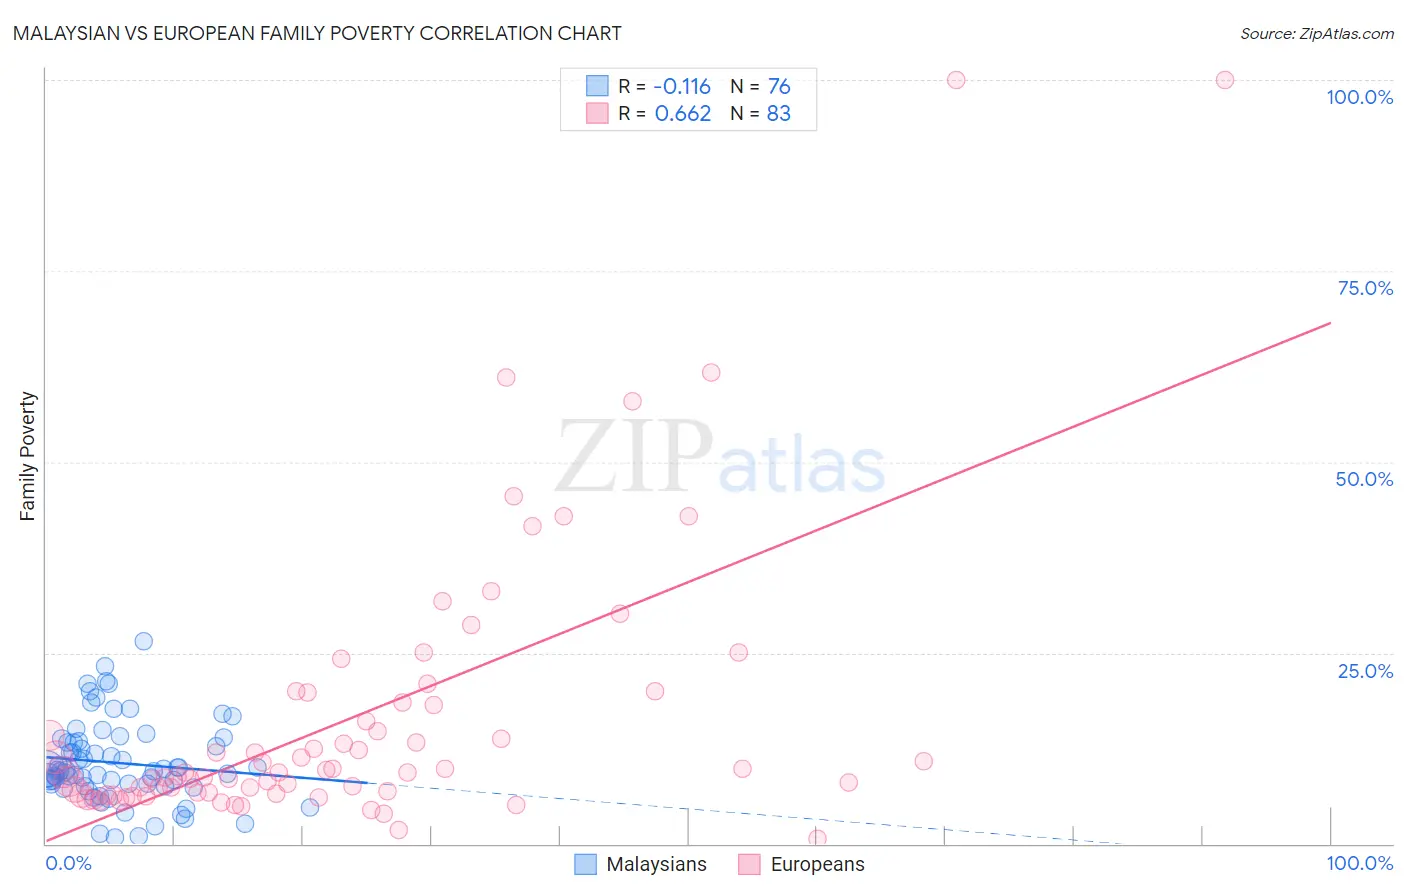
Malaysian vs European Family Poverty Correlation Chart
The statistical analysis conducted on geographies consisting of 225,820,705 people shows a poor negative correlation between the proportion of Malaysians and poverty level among families in the United States with a correlation coefficient (R) of -0.116 and weighted average of 9.6%. Similarly, the statistical analysis conducted on geographies consisting of 557,705,193 people shows a significant positive correlation between the proportion of Europeans and poverty level among families in the United States with a correlation coefficient (R) of 0.662 and weighted average of 7.7%, a difference of 24.6%.
Family Poverty Correlation Summary
| Measurement | Malaysian | European |
| Minimum | 0.81% | 0.65% |
| Maximum | 26.5% | 100.0% |
| Range | 25.6% | 99.4% |
| Mean | 10.6% | 16.6% |
| Median | 9.6% | 9.3% |
| Interquartile 25% (IQ1) | 7.7% | 6.7% |
| Interquartile 75% (IQ3) | 13.3% | 18.4% |
| Interquartile Range (IQR) | 5.6% | 11.8% |
| Standard Deviation (Sample) | 5.3% | 18.6% |
| Standard Deviation (Population) | 5.3% | 18.5% |
Similar Demographics by Family Poverty
Demographics Similar to Malaysians by Family Poverty
In terms of family poverty, the demographic groups most similar to Malaysians are Alsatian (9.6%, a difference of 0.23%), Immigrants from Thailand (9.7%, a difference of 0.30%), Osage (9.7%, a difference of 0.94%), Immigrants from Uruguay (9.5%, a difference of 0.97%), and Immigrants from Eastern Africa (9.5%, a difference of 1.3%).
| Demographics | Rating | Rank | Family Poverty |
| Immigrants | Lebanon | 18.9 /100 | #204 | Poor 9.4% |
| Aleuts | 18.0 /100 | #205 | Poor 9.5% |
| Immigrants | South America | 18.0 /100 | #206 | Poor 9.5% |
| Sierra Leoneans | 15.6 /100 | #207 | Poor 9.5% |
| Immigrants | Eastern Africa | 15.1 /100 | #208 | Poor 9.5% |
| Immigrants | Uruguay | 14.0 /100 | #209 | Poor 9.5% |
| Alsatians | 11.3 /100 | #210 | Poor 9.6% |
| Malaysians | 10.6 /100 | #211 | Poor 9.6% |
| Immigrants | Thailand | 9.7 /100 | #212 | Tragic 9.7% |
| Osage | 8.0 /100 | #213 | Tragic 9.7% |
| Immigrants | Micronesia | 6.7 /100 | #214 | Tragic 9.8% |
| Immigrants | Nonimmigrants | 6.7 /100 | #215 | Tragic 9.8% |
| Moroccans | 6.5 /100 | #216 | Tragic 9.8% |
| Americans | 6.2 /100 | #217 | Tragic 9.8% |
| Panamanians | 5.6 /100 | #218 | Tragic 9.8% |
Demographics Similar to Europeans by Family Poverty
In terms of family poverty, the demographic groups most similar to Europeans are Finnish (7.7%, a difference of 0.010%), Immigrants from Greece (7.7%, a difference of 0.010%), Asian (7.7%, a difference of 0.040%), Immigrants from Serbia (7.7%, a difference of 0.13%), and Immigrants from Eastern Asia (7.7%, a difference of 0.17%).
| Demographics | Rating | Rank | Family Poverty |
| Indians (Asian) | 98.8 /100 | #52 | Exceptional 7.7% |
| Swiss | 98.8 /100 | #53 | Exceptional 7.7% |
| Immigrants | Sweden | 98.8 /100 | #54 | Exceptional 7.7% |
| Immigrants | Eastern Asia | 98.7 /100 | #55 | Exceptional 7.7% |
| Immigrants | Serbia | 98.7 /100 | #56 | Exceptional 7.7% |
| Asians | 98.7 /100 | #57 | Exceptional 7.7% |
| Finns | 98.7 /100 | #58 | Exceptional 7.7% |
| Europeans | 98.7 /100 | #59 | Exceptional 7.7% |
| Immigrants | Greece | 98.7 /100 | #60 | Exceptional 7.7% |
| Immigrants | Netherlands | 98.6 /100 | #61 | Exceptional 7.7% |
| Macedonians | 98.6 /100 | #62 | Exceptional 7.8% |
| Zimbabweans | 98.4 /100 | #63 | Exceptional 7.8% |
| Koreans | 98.3 /100 | #64 | Exceptional 7.8% |
| Immigrants | Bulgaria | 98.3 /100 | #65 | Exceptional 7.8% |
| Dutch | 98.3 /100 | #66 | Exceptional 7.8% |