Malaysian vs Nicaraguan Median Earnings
COMPARE
Malaysian
Nicaraguan
Median Earnings
Median Earnings Comparison
Malaysians
Nicaraguans
$43,844
MEDIAN EARNINGS
2.6/ 100
METRIC RATING
249th/ 347
METRIC RANK
$43,026
MEDIAN EARNINGS
0.8/ 100
METRIC RATING
262nd/ 347
METRIC RANK
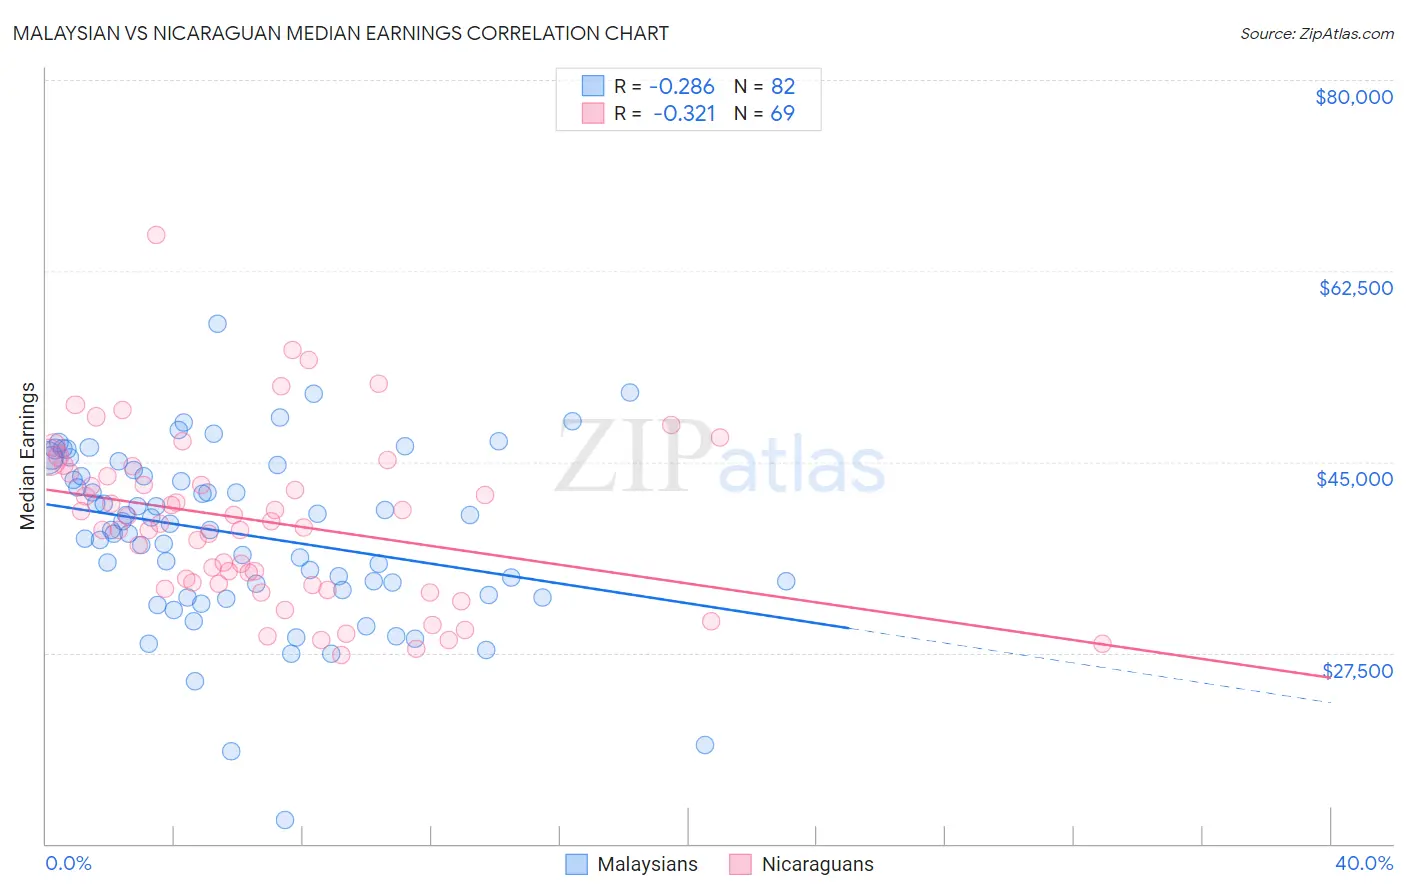
Malaysian vs Nicaraguan Median Earnings Correlation Chart
The statistical analysis conducted on geographies consisting of 226,109,286 people shows a weak negative correlation between the proportion of Malaysians and median earnings in the United States with a correlation coefficient (R) of -0.286 and weighted average of $43,844. Similarly, the statistical analysis conducted on geographies consisting of 285,714,618 people shows a mild negative correlation between the proportion of Nicaraguans and median earnings in the United States with a correlation coefficient (R) of -0.321 and weighted average of $43,026, a difference of 1.9%.
Median Earnings Correlation Summary
| Measurement | Malaysian | Nicaraguan |
| Minimum | $12,196 | $27,330 |
| Maximum | $57,662 | $65,764 |
| Range | $45,466 | $38,434 |
| Mean | $38,334 | $39,567 |
| Median | $39,047 | $39,352 |
| Interquartile 25% (IQ1) | $33,295 | $33,795 |
| Interquartile 75% (IQ3) | $44,277 | $44,292 |
| Interquartile Range (IQR) | $10,982 | $10,497 |
| Standard Deviation (Sample) | $7,931 | $7,612 |
| Standard Deviation (Population) | $7,883 | $7,557 |
Demographics Similar to Malaysians and Nicaraguans by Median Earnings
In terms of median earnings, the demographic groups most similar to Malaysians are Nepalese ($43,860, a difference of 0.040%), Alaska Native ($43,750, a difference of 0.22%), Immigrants from Cabo Verde ($43,963, a difference of 0.27%), Immigrants from West Indies ($43,989, a difference of 0.33%), and Tsimshian ($43,695, a difference of 0.34%). Similarly, the demographic groups most similar to Nicaraguans are Immigrants from Jamaica ($43,026, a difference of 0.0%), Inupiat ($43,000, a difference of 0.060%), Immigrants from Somalia ($43,100, a difference of 0.17%), Immigrants from Liberia ($42,923, a difference of 0.24%), and Salvadoran ($42,912, a difference of 0.27%).
| Demographics | Rating | Rank | Median Earnings |
| Immigrants | Burma/Myanmar | 3.2 /100 | #245 | Tragic $43,998 |
| Immigrants | West Indies | 3.1 /100 | #246 | Tragic $43,989 |
| Immigrants | Cabo Verde | 3.0 /100 | #247 | Tragic $43,963 |
| Nepalese | 2.6 /100 | #248 | Tragic $43,860 |
| Malaysians | 2.6 /100 | #249 | Tragic $43,844 |
| Alaska Natives | 2.3 /100 | #250 | Tragic $43,750 |
| Tsimshian | 2.1 /100 | #251 | Tragic $43,695 |
| Hawaiians | 2.0 /100 | #252 | Tragic $43,673 |
| Somalis | 1.8 /100 | #253 | Tragic $43,567 |
| Liberians | 1.7 /100 | #254 | Tragic $43,536 |
| Immigrants | Middle Africa | 1.4 /100 | #255 | Tragic $43,416 |
| Alaskan Athabascans | 1.4 /100 | #256 | Tragic $43,393 |
| Jamaicans | 1.3 /100 | #257 | Tragic $43,343 |
| French American Indians | 1.3 /100 | #258 | Tragic $43,333 |
| German Russians | 1.1 /100 | #259 | Tragic $43,200 |
| Immigrants | Somalia | 0.9 /100 | #260 | Tragic $43,100 |
| Immigrants | Jamaica | 0.8 /100 | #261 | Tragic $43,026 |
| Nicaraguans | 0.8 /100 | #262 | Tragic $43,026 |
| Inupiat | 0.8 /100 | #263 | Tragic $43,000 |
| Immigrants | Liberia | 0.7 /100 | #264 | Tragic $42,923 |
| Salvadorans | 0.7 /100 | #265 | Tragic $42,912 |