Aleut vs Immigrants from Southern Europe Female Poverty
COMPARE
Aleut
Immigrants from Southern Europe
Female Poverty
Female Poverty Comparison
Aleuts
Immigrants from Southern Europe
13.4%
FEMALE POVERTY
56.7/ 100
METRIC RATING
168th/ 347
METRIC RANK
12.7%
FEMALE POVERTY
90.9/ 100
METRIC RATING
117th/ 347
METRIC RANK
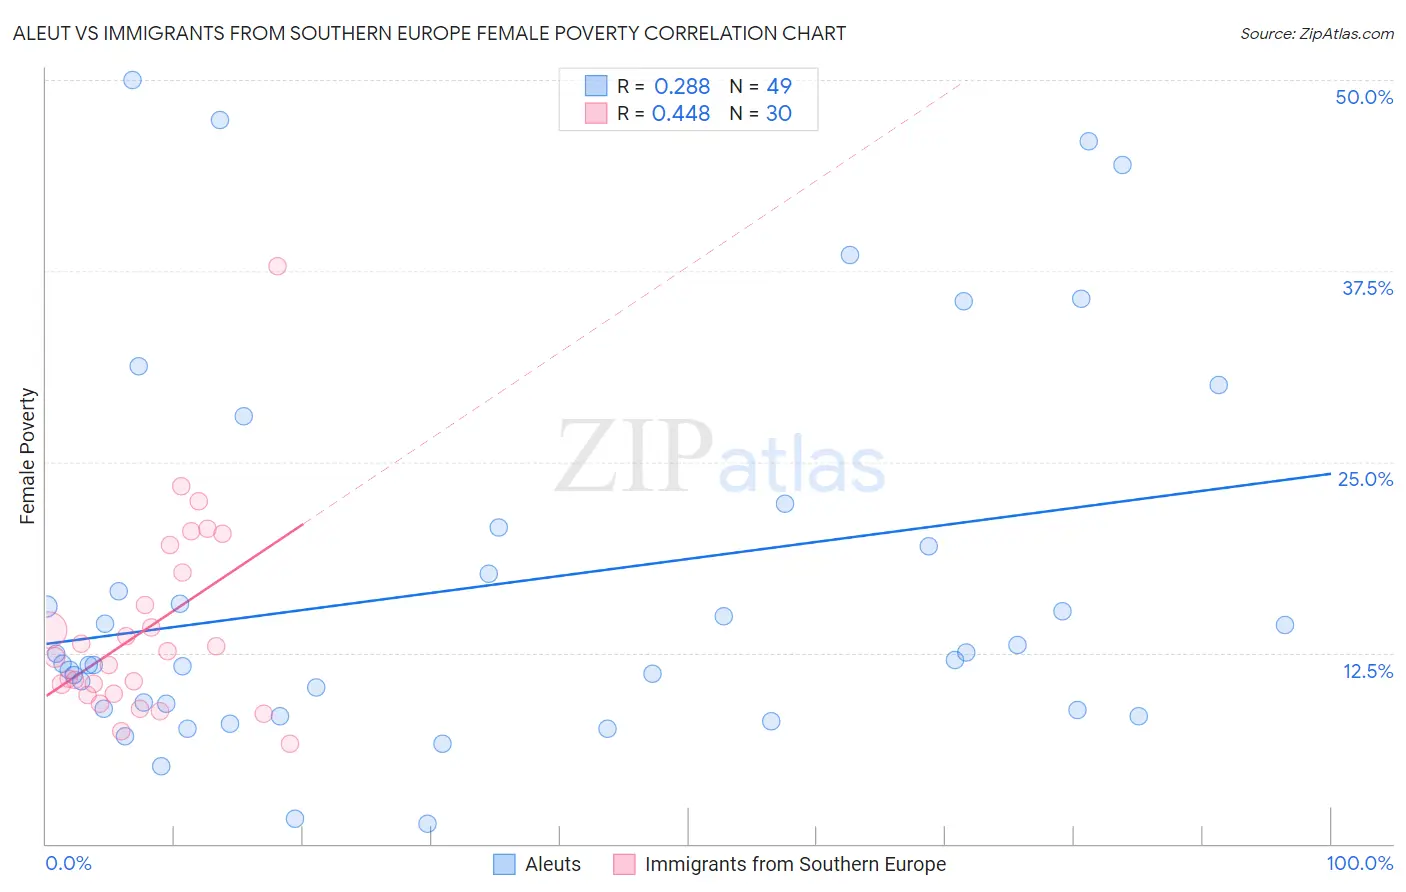
Aleut vs Immigrants from Southern Europe Female Poverty Correlation Chart
The statistical analysis conducted on geographies consisting of 61,771,544 people shows a weak positive correlation between the proportion of Aleuts and poverty level among females in the United States with a correlation coefficient (R) of 0.288 and weighted average of 13.4%. Similarly, the statistical analysis conducted on geographies consisting of 402,507,069 people shows a moderate positive correlation between the proportion of Immigrants from Southern Europe and poverty level among females in the United States with a correlation coefficient (R) of 0.448 and weighted average of 12.7%, a difference of 5.2%.
Female Poverty Correlation Summary
| Measurement | Aleut | Immigrants from Southern Europe |
| Minimum | 1.3% | 6.6% |
| Maximum | 50.0% | 37.8% |
| Range | 48.7% | 31.3% |
| Mean | 16.9% | 14.1% |
| Median | 12.0% | 12.4% |
| Interquartile 25% (IQ1) | 8.8% | 9.8% |
| Interquartile 75% (IQ3) | 20.1% | 17.8% |
| Interquartile Range (IQR) | 11.3% | 8.0% |
| Standard Deviation (Sample) | 12.3% | 6.5% |
| Standard Deviation (Population) | 12.2% | 6.4% |
Similar Demographics by Female Poverty
Demographics Similar to Aleuts by Female Poverty
In terms of female poverty, the demographic groups most similar to Aleuts are Immigrants from Chile (13.3%, a difference of 0.060%), Lebanese (13.4%, a difference of 0.080%), Colombian (13.4%, a difference of 0.10%), White/Caucasian (13.4%, a difference of 0.21%), and Immigrants from Oceania (13.3%, a difference of 0.30%).
| Demographics | Rating | Rank | Female Poverty |
| Immigrants | Ethiopia | 62.5 /100 | #161 | Good 13.3% |
| Guamanians/Chamorros | 62.4 /100 | #162 | Good 13.3% |
| Immigrants | Albania | 62.4 /100 | #163 | Good 13.3% |
| Ethiopians | 62.3 /100 | #164 | Good 13.3% |
| Scotch-Irish | 62.1 /100 | #165 | Good 13.3% |
| Immigrants | Oceania | 59.7 /100 | #166 | Average 13.3% |
| Immigrants | Chile | 57.4 /100 | #167 | Average 13.3% |
| Aleuts | 56.7 /100 | #168 | Average 13.4% |
| Lebanese | 55.9 /100 | #169 | Average 13.4% |
| Colombians | 55.7 /100 | #170 | Average 13.4% |
| Whites/Caucasians | 54.6 /100 | #171 | Average 13.4% |
| Mongolians | 53.6 /100 | #172 | Average 13.4% |
| Immigrants | Afghanistan | 50.8 /100 | #173 | Average 13.4% |
| Immigrants | Iraq | 50.0 /100 | #174 | Average 13.4% |
| Celtics | 49.9 /100 | #175 | Average 13.4% |
Demographics Similar to Immigrants from Southern Europe by Female Poverty
In terms of female poverty, the demographic groups most similar to Immigrants from Southern Europe are Sri Lankan (12.7%, a difference of 0.020%), Albanian (12.7%, a difference of 0.030%), Immigrants from Russia (12.7%, a difference of 0.070%), New Zealander (12.7%, a difference of 0.090%), and Immigrants from Hungary (12.7%, a difference of 0.19%).
| Demographics | Rating | Rank | Female Poverty |
| Paraguayans | 93.0 /100 | #110 | Exceptional 12.6% |
| Soviet Union | 92.4 /100 | #111 | Exceptional 12.6% |
| Immigrants | Israel | 92.0 /100 | #112 | Exceptional 12.6% |
| Canadians | 92.0 /100 | #113 | Exceptional 12.7% |
| Welsh | 91.6 /100 | #114 | Exceptional 12.7% |
| Puget Sound Salish | 91.5 /100 | #115 | Exceptional 12.7% |
| Immigrants | Russia | 91.2 /100 | #116 | Exceptional 12.7% |
| Immigrants | Southern Europe | 90.9 /100 | #117 | Exceptional 12.7% |
| Sri Lankans | 90.9 /100 | #118 | Exceptional 12.7% |
| Albanians | 90.8 /100 | #119 | Exceptional 12.7% |
| New Zealanders | 90.6 /100 | #120 | Exceptional 12.7% |
| Immigrants | Hungary | 90.3 /100 | #121 | Exceptional 12.7% |
| French Canadians | 90.2 /100 | #122 | Exceptional 12.7% |
| Immigrants | South Eastern Asia | 89.9 /100 | #123 | Excellent 12.7% |
| Immigrants | Norway | 89.3 /100 | #124 | Excellent 12.8% |