Macedonian vs Immigrants from Argentina Single Mother Poverty
COMPARE
Macedonian
Immigrants from Argentina
Single Mother Poverty
Single Mother Poverty Comparison
Macedonians
Immigrants from Argentina
27.4%
SINGLE MOTHER POVERTY
99.4/ 100
METRIC RATING
71st/ 347
METRIC RANK
27.1%
SINGLE MOTHER POVERTY
99.7/ 100
METRIC RATING
51st/ 347
METRIC RANK
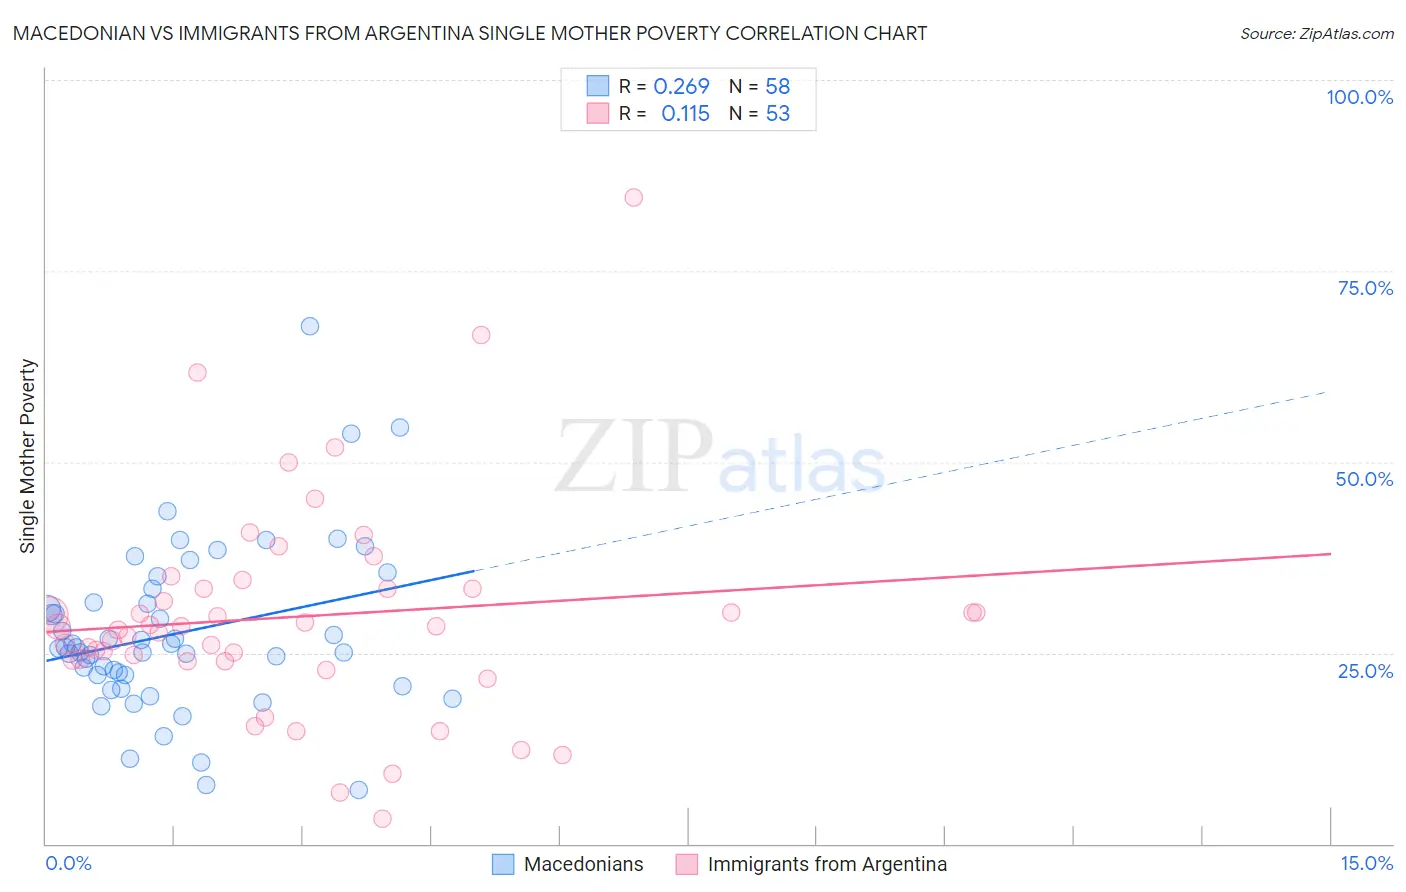
Macedonian vs Immigrants from Argentina Single Mother Poverty Correlation Chart
The statistical analysis conducted on geographies consisting of 130,650,018 people shows a weak positive correlation between the proportion of Macedonians and poverty level among single mothers in the United States with a correlation coefficient (R) of 0.269 and weighted average of 27.4%. Similarly, the statistical analysis conducted on geographies consisting of 259,658,600 people shows a poor positive correlation between the proportion of Immigrants from Argentina and poverty level among single mothers in the United States with a correlation coefficient (R) of 0.115 and weighted average of 27.1%, a difference of 1.1%.
Single Mother Poverty Correlation Summary
| Measurement | Macedonian | Immigrants from Argentina |
| Minimum | 7.0% | 3.3% |
| Maximum | 67.8% | 84.6% |
| Range | 60.8% | 81.3% |
| Mean | 27.6% | 29.7% |
| Median | 25.7% | 28.5% |
| Interquartile 25% (IQ1) | 22.1% | 24.0% |
| Interquartile 75% (IQ3) | 31.6% | 33.3% |
| Interquartile Range (IQR) | 9.5% | 9.3% |
| Standard Deviation (Sample) | 11.0% | 14.2% |
| Standard Deviation (Population) | 10.9% | 14.1% |
Demographics Similar to Macedonians and Immigrants from Argentina by Single Mother Poverty
In terms of single mother poverty, the demographic groups most similar to Macedonians are Immigrants from Belarus (27.4%, a difference of 0.020%), Lithuanian (27.4%, a difference of 0.030%), Immigrants from Czechoslovakia (27.4%, a difference of 0.19%), Immigrants from Australia (27.3%, a difference of 0.22%), and Soviet Union (27.3%, a difference of 0.24%). Similarly, the demographic groups most similar to Immigrants from Argentina are Immigrants from South Eastern Asia (27.1%, a difference of 0.040%), Immigrants from Jordan (27.1%, a difference of 0.080%), Immigrants from Bulgaria (27.1%, a difference of 0.11%), Immigrants from Egypt (27.1%, a difference of 0.14%), and Immigrants from Romania (27.2%, a difference of 0.19%).
| Demographics | Rating | Rank | Single Mother Poverty |
| Immigrants | Argentina | 99.7 /100 | #51 | Exceptional 27.1% |
| Immigrants | South Eastern Asia | 99.7 /100 | #52 | Exceptional 27.1% |
| Immigrants | Jordan | 99.7 /100 | #53 | Exceptional 27.1% |
| Immigrants | Bulgaria | 99.7 /100 | #54 | Exceptional 27.1% |
| Immigrants | Egypt | 99.7 /100 | #55 | Exceptional 27.1% |
| Immigrants | Romania | 99.7 /100 | #56 | Exceptional 27.2% |
| Palestinians | 99.7 /100 | #57 | Exceptional 27.2% |
| Argentineans | 99.6 /100 | #58 | Exceptional 27.2% |
| Paraguayans | 99.6 /100 | #59 | Exceptional 27.2% |
| Eastern Europeans | 99.6 /100 | #60 | Exceptional 27.2% |
| Immigrants | Eastern Europe | 99.6 /100 | #61 | Exceptional 27.2% |
| Immigrants | Malaysia | 99.5 /100 | #62 | Exceptional 27.3% |
| Immigrants | Northern Europe | 99.5 /100 | #63 | Exceptional 27.3% |
| Russians | 99.5 /100 | #64 | Exceptional 27.3% |
| Immigrants | Turkey | 99.5 /100 | #65 | Exceptional 27.3% |
| Soviet Union | 99.5 /100 | #66 | Exceptional 27.3% |
| Immigrants | Australia | 99.5 /100 | #67 | Exceptional 27.3% |
| Immigrants | Czechoslovakia | 99.5 /100 | #68 | Exceptional 27.4% |
| Lithuanians | 99.4 /100 | #69 | Exceptional 27.4% |
| Immigrants | Belarus | 99.4 /100 | #70 | Exceptional 27.4% |
| Macedonians | 99.4 /100 | #71 | Exceptional 27.4% |