Macedonian vs Immigrants from Argentina 5th Grade
COMPARE
Macedonian
Immigrants from Argentina
5th Grade
5th Grade Comparison
Macedonians
Immigrants from Argentina
97.9%
5TH GRADE
99.4/ 100
METRIC RATING
72nd/ 347
METRIC RANK
97.3%
5TH GRADE
36.1/ 100
METRIC RATING
186th/ 347
METRIC RANK
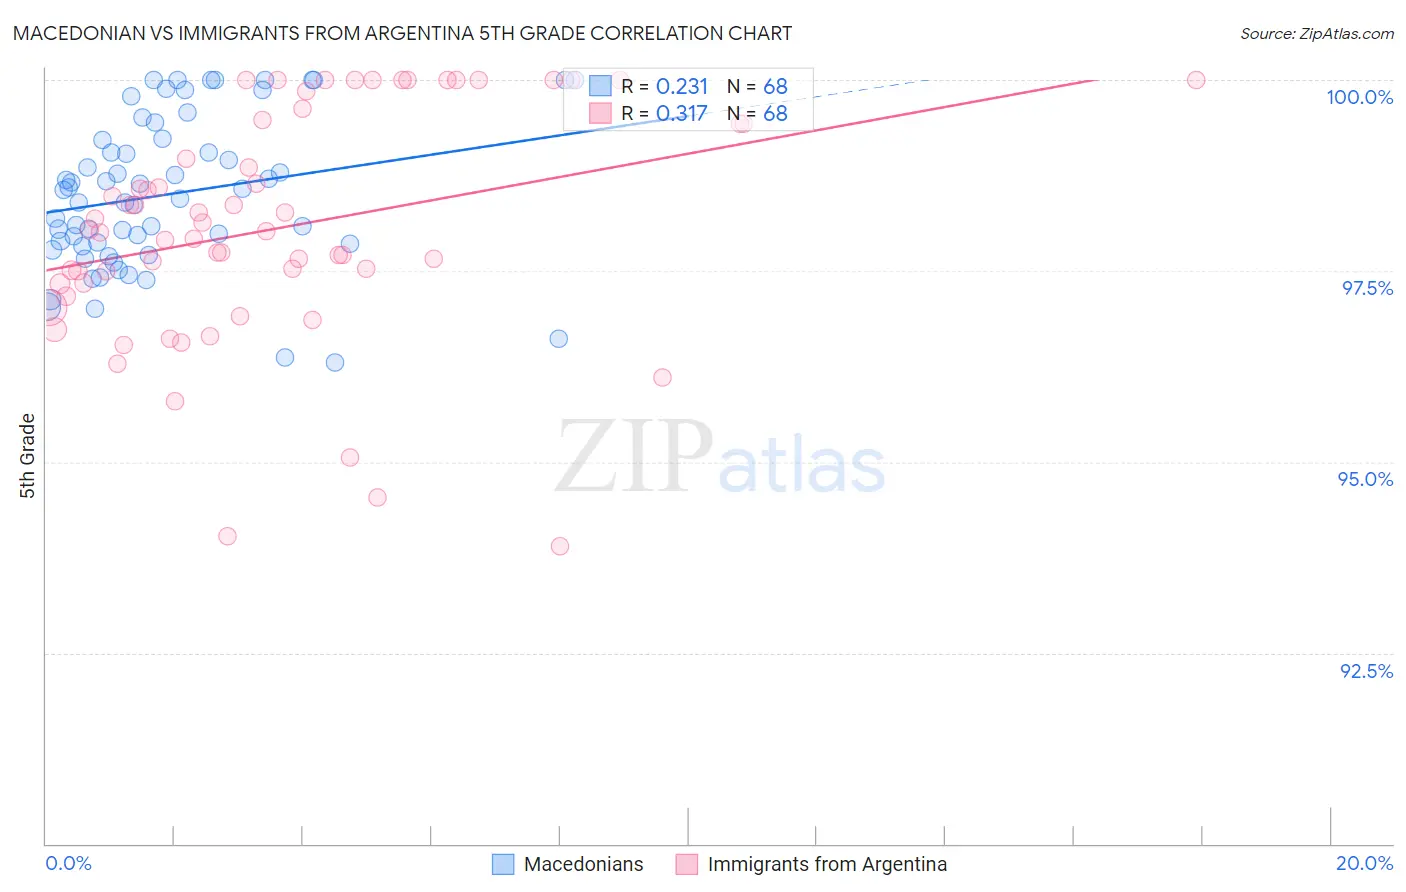
Macedonian vs Immigrants from Argentina 5th Grade Correlation Chart
The statistical analysis conducted on geographies consisting of 132,592,860 people shows a weak positive correlation between the proportion of Macedonians and percentage of population with at least 5th grade education in the United States with a correlation coefficient (R) of 0.231 and weighted average of 97.9%. Similarly, the statistical analysis conducted on geographies consisting of 264,434,317 people shows a mild positive correlation between the proportion of Immigrants from Argentina and percentage of population with at least 5th grade education in the United States with a correlation coefficient (R) of 0.317 and weighted average of 97.3%, a difference of 0.59%.
5th Grade Correlation Summary
| Measurement | Macedonian | Immigrants from Argentina |
| Minimum | 96.3% | 93.9% |
| Maximum | 100.0% | 100.0% |
| Range | 3.7% | 6.1% |
| Mean | 98.5% | 98.1% |
| Median | 98.5% | 98.0% |
| Interquartile 25% (IQ1) | 97.8% | 97.3% |
| Interquartile 75% (IQ3) | 99.2% | 99.5% |
| Interquartile Range (IQR) | 1.4% | 2.1% |
| Standard Deviation (Sample) | 0.99% | 1.5% |
| Standard Deviation (Population) | 0.98% | 1.5% |
Similar Demographics by 5th Grade
Demographics Similar to Macedonians by 5th Grade
In terms of 5th grade, the demographic groups most similar to Macedonians are Iranian (97.9%, a difference of 0.010%), Chickasaw (97.9%, a difference of 0.010%), Cherokee (97.8%, a difference of 0.010%), Kiowa (97.9%, a difference of 0.020%), and Lumbee (97.8%, a difference of 0.020%).
| Demographics | Rating | Rank | 5th Grade |
| Canadians | 99.6 /100 | #65 | Exceptional 97.9% |
| Immigrants | Austria | 99.6 /100 | #66 | Exceptional 97.9% |
| New Zealanders | 99.6 /100 | #67 | Exceptional 97.9% |
| Cajuns | 99.6 /100 | #68 | Exceptional 97.9% |
| Kiowa | 99.5 /100 | #69 | Exceptional 97.9% |
| Iranians | 99.5 /100 | #70 | Exceptional 97.9% |
| Chickasaw | 99.5 /100 | #71 | Exceptional 97.9% |
| Macedonians | 99.4 /100 | #72 | Exceptional 97.9% |
| Cherokee | 99.4 /100 | #73 | Exceptional 97.8% |
| Lumbee | 99.3 /100 | #74 | Exceptional 97.8% |
| Ukrainians | 99.3 /100 | #75 | Exceptional 97.8% |
| Immigrants | Netherlands | 99.3 /100 | #76 | Exceptional 97.8% |
| Immigrants | England | 99.3 /100 | #77 | Exceptional 97.8% |
| Osage | 99.3 /100 | #78 | Exceptional 97.8% |
| Immigrants | Lithuania | 99.2 /100 | #79 | Exceptional 97.8% |
Demographics Similar to Immigrants from Argentina by 5th Grade
In terms of 5th grade, the demographic groups most similar to Immigrants from Argentina are Dutch West Indian (97.3%, a difference of 0.0%), Mongolian (97.3%, a difference of 0.010%), Immigrants from Ukraine (97.3%, a difference of 0.010%), Immigrants from Venezuela (97.3%, a difference of 0.010%), and Spanish American (97.3%, a difference of 0.010%).
| Demographics | Rating | Rank | 5th Grade |
| Immigrants | Kenya | 40.3 /100 | #179 | Average 97.3% |
| Pakistanis | 40.2 /100 | #180 | Average 97.3% |
| Argentineans | 39.5 /100 | #181 | Fair 97.3% |
| Mongolians | 39.4 /100 | #182 | Fair 97.3% |
| Immigrants | Ukraine | 38.6 /100 | #183 | Fair 97.3% |
| Immigrants | Venezuela | 38.4 /100 | #184 | Fair 97.3% |
| Dutch West Indians | 36.2 /100 | #185 | Fair 97.3% |
| Immigrants | Argentina | 36.1 /100 | #186 | Fair 97.3% |
| Spanish Americans | 34.7 /100 | #187 | Fair 97.3% |
| Paraguayans | 33.7 /100 | #188 | Fair 97.3% |
| Immigrants | Egypt | 32.9 /100 | #189 | Fair 97.3% |
| Blacks/African Americans | 31.8 /100 | #190 | Fair 97.3% |
| Immigrants | Brazil | 31.5 /100 | #191 | Fair 97.3% |
| Panamanians | 31.3 /100 | #192 | Fair 97.3% |
| Navajo | 29.0 /100 | #193 | Fair 97.2% |