Macedonian vs Cape Verdean Single Mother Poverty
COMPARE
Macedonian
Cape Verdean
Single Mother Poverty
Single Mother Poverty Comparison
Macedonians
Cape Verdeans
27.4%
SINGLE MOTHER POVERTY
99.4/ 100
METRIC RATING
71st/ 347
METRIC RANK
30.8%
SINGLE MOTHER POVERTY
0.8/ 100
METRIC RATING
249th/ 347
METRIC RANK
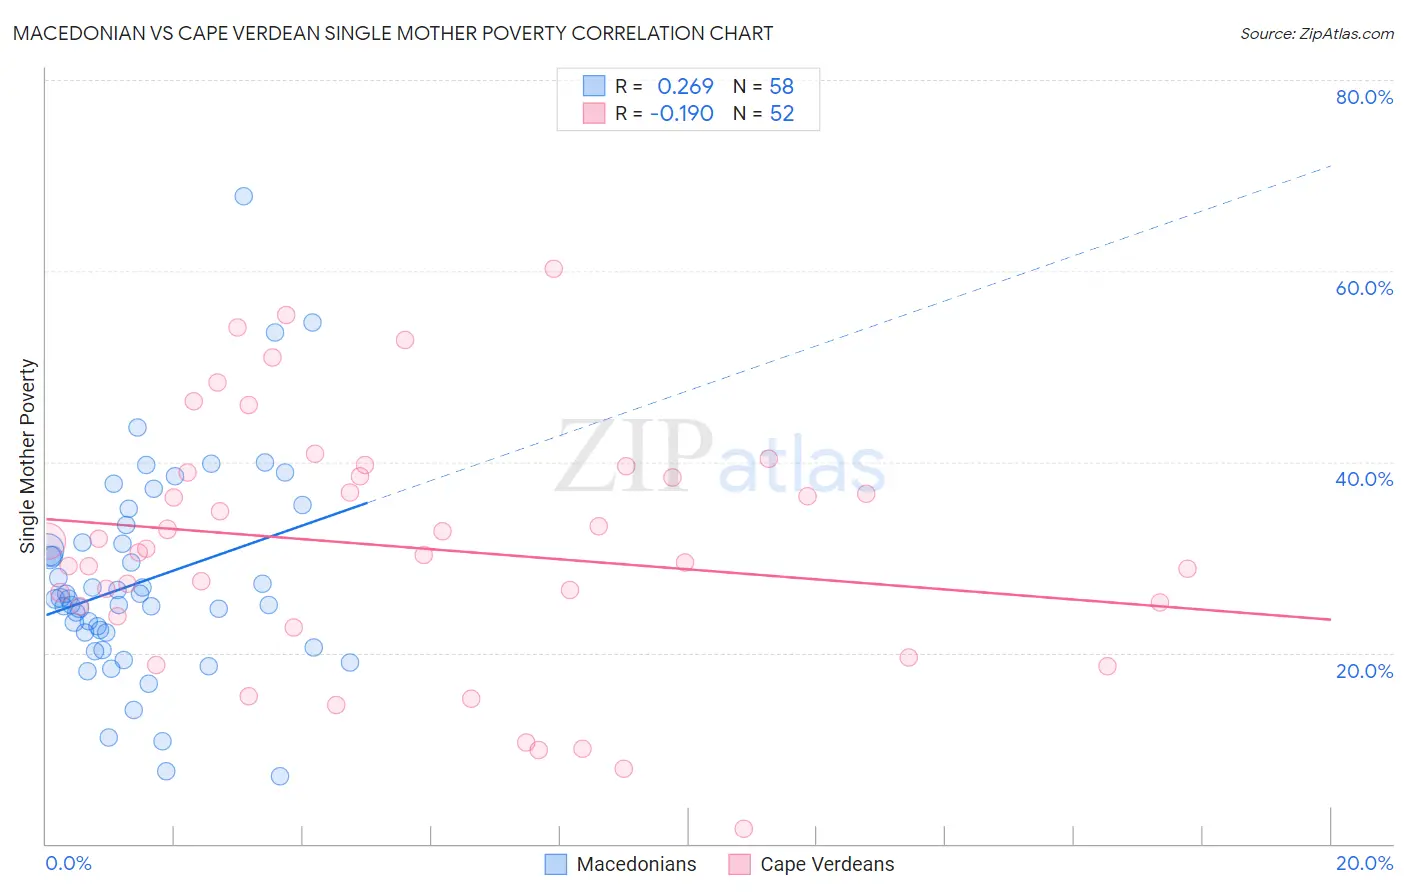
Macedonian vs Cape Verdean Single Mother Poverty Correlation Chart
The statistical analysis conducted on geographies consisting of 130,650,018 people shows a weak positive correlation between the proportion of Macedonians and poverty level among single mothers in the United States with a correlation coefficient (R) of 0.269 and weighted average of 27.4%. Similarly, the statistical analysis conducted on geographies consisting of 106,661,229 people shows a poor negative correlation between the proportion of Cape Verdeans and poverty level among single mothers in the United States with a correlation coefficient (R) of -0.190 and weighted average of 30.8%, a difference of 12.5%.
Single Mother Poverty Correlation Summary
| Measurement | Macedonian | Cape Verdean |
| Minimum | 7.0% | 1.6% |
| Maximum | 67.8% | 60.3% |
| Range | 60.8% | 58.7% |
| Mean | 27.6% | 31.1% |
| Median | 25.7% | 30.7% |
| Interquartile 25% (IQ1) | 22.1% | 24.4% |
| Interquartile 75% (IQ3) | 31.6% | 38.7% |
| Interquartile Range (IQR) | 9.5% | 14.3% |
| Standard Deviation (Sample) | 11.0% | 12.9% |
| Standard Deviation (Population) | 10.9% | 12.8% |
Similar Demographics by Single Mother Poverty
Demographics Similar to Macedonians by Single Mother Poverty
In terms of single mother poverty, the demographic groups most similar to Macedonians are Immigrants from Belarus (27.4%, a difference of 0.020%), Immigrants from Russia (27.4%, a difference of 0.020%), Lithuanian (27.4%, a difference of 0.030%), Sierra Leonean (27.4%, a difference of 0.090%), and Immigrants from Europe (27.4%, a difference of 0.15%).
| Demographics | Rating | Rank | Single Mother Poverty |
| Russians | 99.5 /100 | #64 | Exceptional 27.3% |
| Immigrants | Turkey | 99.5 /100 | #65 | Exceptional 27.3% |
| Soviet Union | 99.5 /100 | #66 | Exceptional 27.3% |
| Immigrants | Australia | 99.5 /100 | #67 | Exceptional 27.3% |
| Immigrants | Czechoslovakia | 99.5 /100 | #68 | Exceptional 27.4% |
| Lithuanians | 99.4 /100 | #69 | Exceptional 27.4% |
| Immigrants | Belarus | 99.4 /100 | #70 | Exceptional 27.4% |
| Macedonians | 99.4 /100 | #71 | Exceptional 27.4% |
| Immigrants | Russia | 99.4 /100 | #72 | Exceptional 27.4% |
| Sierra Leoneans | 99.3 /100 | #73 | Exceptional 27.4% |
| Immigrants | Europe | 99.3 /100 | #74 | Exceptional 27.4% |
| Immigrants | Sweden | 99.2 /100 | #75 | Exceptional 27.5% |
| Peruvians | 99.2 /100 | #76 | Exceptional 27.5% |
| Immigrants | Peru | 99.2 /100 | #77 | Exceptional 27.5% |
| Immigrants | North Macedonia | 99.2 /100 | #78 | Exceptional 27.5% |
Demographics Similar to Cape Verdeans by Single Mother Poverty
In terms of single mother poverty, the demographic groups most similar to Cape Verdeans are French Canadian (30.8%, a difference of 0.080%), West Indian (30.8%, a difference of 0.12%), Ecuadorian (30.8%, a difference of 0.15%), Vietnamese (30.9%, a difference of 0.15%), and Tlingit-Haida (30.9%, a difference of 0.27%).
| Demographics | Rating | Rank | Single Mother Poverty |
| Immigrants | Burma/Myanmar | 1.7 /100 | #242 | Tragic 30.6% |
| Bermudans | 1.6 /100 | #243 | Tragic 30.6% |
| French | 1.3 /100 | #244 | Tragic 30.7% |
| Barbadians | 1.3 /100 | #245 | Tragic 30.7% |
| Ecuadorians | 0.9 /100 | #246 | Tragic 30.8% |
| West Indians | 0.9 /100 | #247 | Tragic 30.8% |
| French Canadians | 0.9 /100 | #248 | Tragic 30.8% |
| Cape Verdeans | 0.8 /100 | #249 | Tragic 30.8% |
| Vietnamese | 0.7 /100 | #250 | Tragic 30.9% |
| Tlingit-Haida | 0.6 /100 | #251 | Tragic 30.9% |
| Alaska Natives | 0.6 /100 | #252 | Tragic 30.9% |
| Celtics | 0.6 /100 | #253 | Tragic 30.9% |
| Senegalese | 0.5 /100 | #254 | Tragic 31.0% |
| Belizeans | 0.5 /100 | #255 | Tragic 31.0% |
| Immigrants | West Indies | 0.4 /100 | #256 | Tragic 31.1% |