Macedonian vs Luxembourger Single Father Poverty
COMPARE
Macedonian
Luxembourger
Single Father Poverty
Single Father Poverty Comparison
Macedonians
Luxembourgers
17.7%
SINGLE FATHER POVERTY
0.1/ 100
METRIC RATING
274th/ 347
METRIC RANK
17.1%
SINGLE FATHER POVERTY
1.1/ 100
METRIC RATING
251st/ 347
METRIC RANK
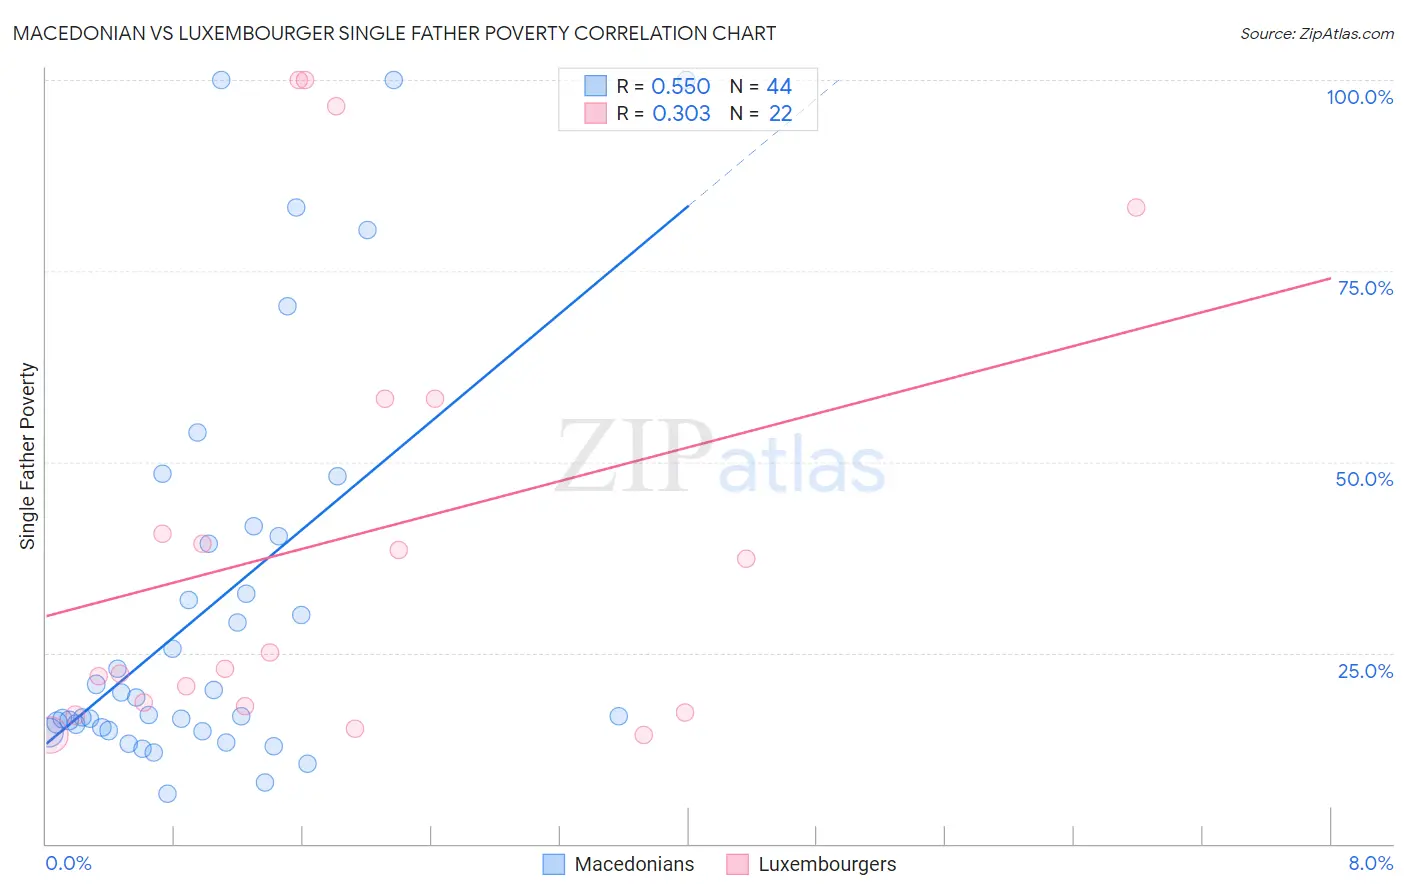
Macedonian vs Luxembourger Single Father Poverty Correlation Chart
The statistical analysis conducted on geographies consisting of 112,665,008 people shows a substantial positive correlation between the proportion of Macedonians and poverty level among single fathers in the United States with a correlation coefficient (R) of 0.550 and weighted average of 17.7%. Similarly, the statistical analysis conducted on geographies consisting of 123,209,888 people shows a mild positive correlation between the proportion of Luxembourgers and poverty level among single fathers in the United States with a correlation coefficient (R) of 0.303 and weighted average of 17.1%, a difference of 3.3%.
Single Father Poverty Correlation Summary
| Measurement | Macedonian | Luxembourger |
| Minimum | 6.6% | 14.2% |
| Maximum | 100.0% | 100.0% |
| Range | 93.4% | 85.8% |
| Mean | 31.1% | 40.0% |
| Median | 18.0% | 24.0% |
| Interquartile 25% (IQ1) | 15.0% | 18.0% |
| Interquartile 75% (IQ3) | 39.8% | 58.3% |
| Interquartile Range (IQR) | 24.8% | 40.4% |
| Standard Deviation (Sample) | 26.1% | 29.6% |
| Standard Deviation (Population) | 25.8% | 29.0% |
Similar Demographics by Single Father Poverty
Demographics Similar to Macedonians by Single Father Poverty
In terms of single father poverty, the demographic groups most similar to Macedonians are British West Indian (17.7%, a difference of 0.070%), German Russian (17.7%, a difference of 0.13%), Lebanese (17.7%, a difference of 0.28%), German (17.7%, a difference of 0.29%), and Iroquois (17.7%, a difference of 0.43%).
| Demographics | Rating | Rank | Single Father Poverty |
| Haitians | 0.3 /100 | #267 | Tragic 17.3% |
| Immigrants | Caribbean | 0.3 /100 | #268 | Tragic 17.4% |
| Slavs | 0.3 /100 | #269 | Tragic 17.4% |
| Indonesians | 0.2 /100 | #270 | Tragic 17.4% |
| French American Indians | 0.2 /100 | #271 | Tragic 17.4% |
| Barbadians | 0.1 /100 | #272 | Tragic 17.5% |
| Italians | 0.1 /100 | #273 | Tragic 17.5% |
| Macedonians | 0.1 /100 | #274 | Tragic 17.7% |
| British West Indians | 0.0 /100 | #275 | Tragic 17.7% |
| German Russians | 0.0 /100 | #276 | Tragic 17.7% |
| Lebanese | 0.0 /100 | #277 | Tragic 17.7% |
| Germans | 0.0 /100 | #278 | Tragic 17.7% |
| Iroquois | 0.0 /100 | #279 | Tragic 17.7% |
| Scottish | 0.0 /100 | #280 | Tragic 17.7% |
| English | 0.0 /100 | #281 | Tragic 17.8% |
Demographics Similar to Luxembourgers by Single Father Poverty
In terms of single father poverty, the demographic groups most similar to Luxembourgers are Austrian (17.1%, a difference of 0.010%), Croatian (17.1%, a difference of 0.10%), Cree (17.1%, a difference of 0.11%), Canadian (17.1%, a difference of 0.14%), and Greek (17.1%, a difference of 0.18%).
| Demographics | Rating | Rank | Single Father Poverty |
| Hondurans | 1.6 /100 | #244 | Tragic 17.0% |
| Trinidadians and Tobagonians | 1.5 /100 | #245 | Tragic 17.0% |
| Immigrants | Ireland | 1.4 /100 | #246 | Tragic 17.1% |
| Greeks | 1.3 /100 | #247 | Tragic 17.1% |
| Czechoslovakians | 1.3 /100 | #248 | Tragic 17.1% |
| Canadians | 1.3 /100 | #249 | Tragic 17.1% |
| Austrians | 1.1 /100 | #250 | Tragic 17.1% |
| Luxembourgers | 1.1 /100 | #251 | Tragic 17.1% |
| Croatians | 1.0 /100 | #252 | Tragic 17.1% |
| Cree | 1.0 /100 | #253 | Tragic 17.1% |
| Immigrants | Honduras | 0.9 /100 | #254 | Tragic 17.1% |
| Sierra Leoneans | 0.8 /100 | #255 | Tragic 17.2% |
| Immigrants | Haiti | 0.8 /100 | #256 | Tragic 17.2% |
| Immigrants | Albania | 0.7 /100 | #257 | Tragic 17.2% |
| Albanians | 0.7 /100 | #258 | Tragic 17.2% |