Luxembourger vs Celtic Single Father Poverty
COMPARE
Luxembourger
Celtic
Single Father Poverty
Single Father Poverty Comparison
Luxembourgers
Celtics
17.1%
SINGLE FATHER POVERTY
1.1/ 100
METRIC RATING
251st/ 347
METRIC RANK
18.5%
SINGLE FATHER POVERTY
0.0/ 100
METRIC RATING
303rd/ 347
METRIC RANK
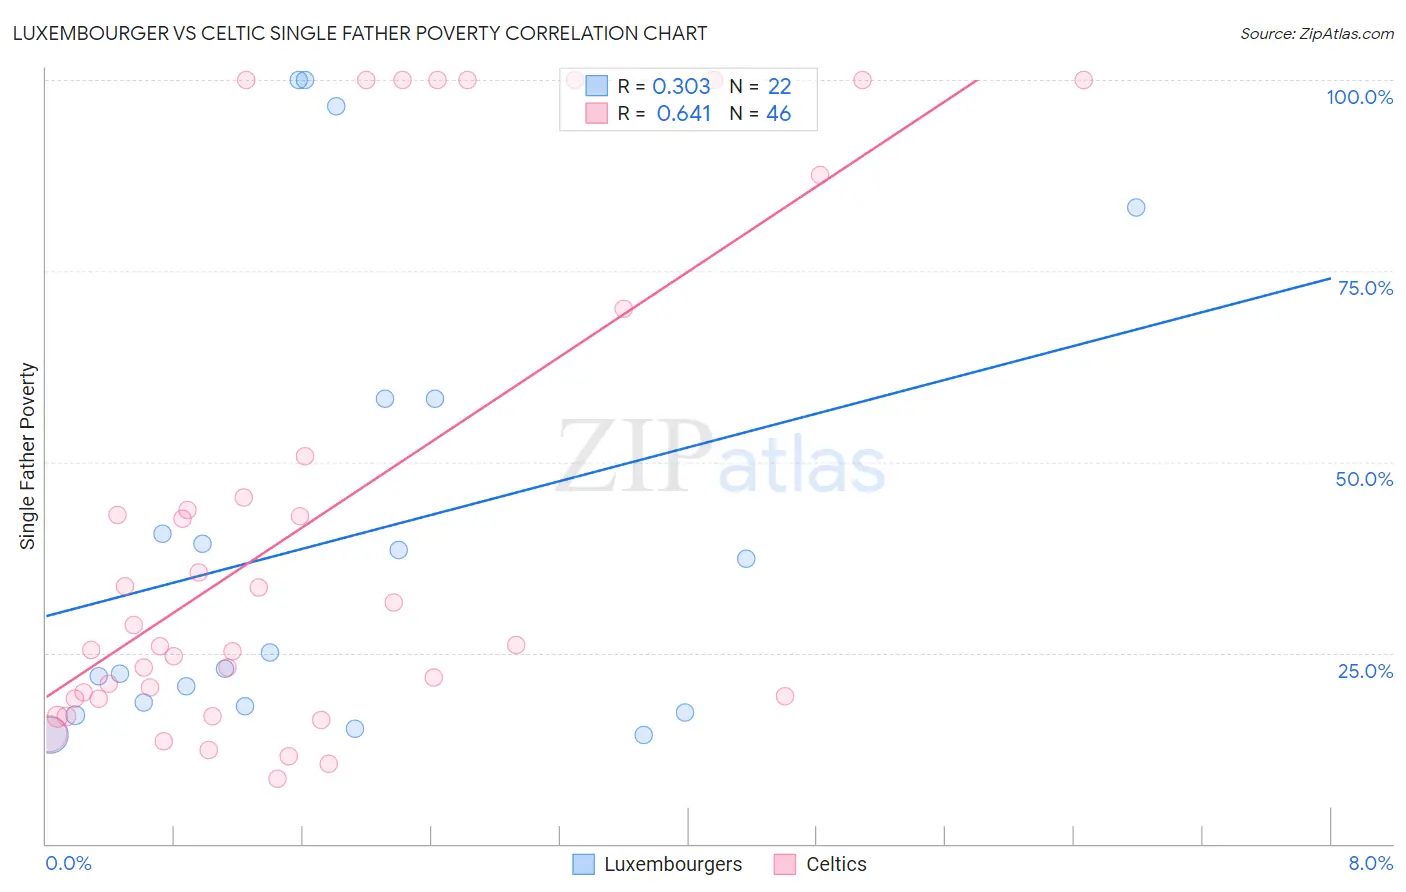
Luxembourger vs Celtic Single Father Poverty Correlation Chart
The statistical analysis conducted on geographies consisting of 123,209,888 people shows a mild positive correlation between the proportion of Luxembourgers and poverty level among single fathers in the United States with a correlation coefficient (R) of 0.303 and weighted average of 17.1%. Similarly, the statistical analysis conducted on geographies consisting of 145,202,349 people shows a significant positive correlation between the proportion of Celtics and poverty level among single fathers in the United States with a correlation coefficient (R) of 0.641 and weighted average of 18.5%, a difference of 8.1%.
Single Father Poverty Correlation Summary
| Measurement | Luxembourger | Celtic |
| Minimum | 14.2% | 8.4% |
| Maximum | 100.0% | 100.0% |
| Range | 85.8% | 91.6% |
| Mean | 40.0% | 42.2% |
| Median | 24.0% | 26.0% |
| Interquartile 25% (IQ1) | 18.0% | 19.0% |
| Interquartile 75% (IQ3) | 58.3% | 50.8% |
| Interquartile Range (IQR) | 40.4% | 31.8% |
| Standard Deviation (Sample) | 29.6% | 32.4% |
| Standard Deviation (Population) | 29.0% | 32.1% |
Similar Demographics by Single Father Poverty
Demographics Similar to Luxembourgers by Single Father Poverty
In terms of single father poverty, the demographic groups most similar to Luxembourgers are Austrian (17.1%, a difference of 0.010%), Croatian (17.1%, a difference of 0.10%), Cree (17.1%, a difference of 0.11%), Canadian (17.1%, a difference of 0.14%), and Greek (17.1%, a difference of 0.18%).
| Demographics | Rating | Rank | Single Father Poverty |
| Hondurans | 1.6 /100 | #244 | Tragic 17.0% |
| Trinidadians and Tobagonians | 1.5 /100 | #245 | Tragic 17.0% |
| Immigrants | Ireland | 1.4 /100 | #246 | Tragic 17.1% |
| Greeks | 1.3 /100 | #247 | Tragic 17.1% |
| Czechoslovakians | 1.3 /100 | #248 | Tragic 17.1% |
| Canadians | 1.3 /100 | #249 | Tragic 17.1% |
| Austrians | 1.1 /100 | #250 | Tragic 17.1% |
| Luxembourgers | 1.1 /100 | #251 | Tragic 17.1% |
| Croatians | 1.0 /100 | #252 | Tragic 17.1% |
| Cree | 1.0 /100 | #253 | Tragic 17.1% |
| Immigrants | Honduras | 0.9 /100 | #254 | Tragic 17.1% |
| Sierra Leoneans | 0.8 /100 | #255 | Tragic 17.2% |
| Immigrants | Haiti | 0.8 /100 | #256 | Tragic 17.2% |
| Immigrants | Albania | 0.7 /100 | #257 | Tragic 17.2% |
| Albanians | 0.7 /100 | #258 | Tragic 17.2% |
Demographics Similar to Celtics by Single Father Poverty
In terms of single father poverty, the demographic groups most similar to Celtics are Comanche (18.5%, a difference of 0.040%), Ute (18.5%, a difference of 0.14%), Hungarian (18.5%, a difference of 0.15%), Blackfeet (18.5%, a difference of 0.19%), and Immigrants from Dominican Republic (18.4%, a difference of 0.37%).
| Demographics | Rating | Rank | Single Father Poverty |
| Seminole | 0.0 /100 | #296 | Tragic 18.1% |
| French | 0.0 /100 | #297 | Tragic 18.2% |
| Africans | 0.0 /100 | #298 | Tragic 18.3% |
| Whites/Caucasians | 0.0 /100 | #299 | Tragic 18.4% |
| Immigrants | Dominican Republic | 0.0 /100 | #300 | Tragic 18.4% |
| Hungarians | 0.0 /100 | #301 | Tragic 18.5% |
| Comanche | 0.0 /100 | #302 | Tragic 18.5% |
| Celtics | 0.0 /100 | #303 | Tragic 18.5% |
| Ute | 0.0 /100 | #304 | Tragic 18.5% |
| Blackfeet | 0.0 /100 | #305 | Tragic 18.5% |
| Scotch-Irish | 0.0 /100 | #306 | Tragic 18.6% |
| French Canadians | 0.0 /100 | #307 | Tragic 18.6% |
| Ottawa | 0.0 /100 | #308 | Tragic 18.6% |
| Immigrants | Micronesia | 0.0 /100 | #309 | Tragic 18.6% |
| Chippewa | 0.0 /100 | #310 | Tragic 18.8% |