Luxembourger vs Immigrants from Ukraine Single Father Poverty
COMPARE
Luxembourger
Immigrants from Ukraine
Single Father Poverty
Single Father Poverty Comparison
Luxembourgers
Immigrants from Ukraine
17.1%
SINGLE FATHER POVERTY
1.1/ 100
METRIC RATING
251st/ 347
METRIC RANK
15.4%
SINGLE FATHER POVERTY
99.4/ 100
METRIC RATING
82nd/ 347
METRIC RANK
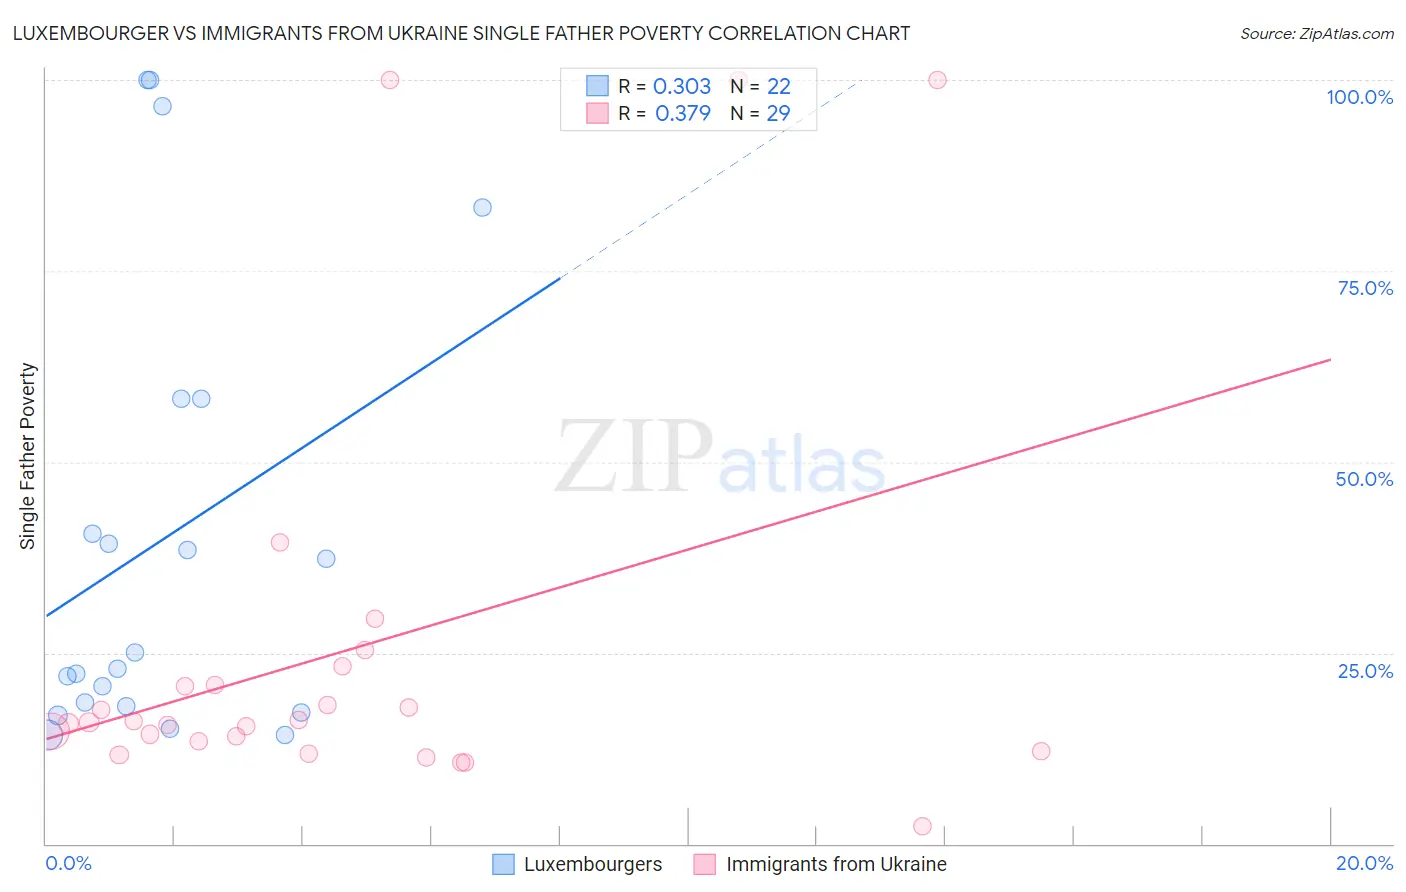
Luxembourger vs Immigrants from Ukraine Single Father Poverty Correlation Chart
The statistical analysis conducted on geographies consisting of 123,209,888 people shows a mild positive correlation between the proportion of Luxembourgers and poverty level among single fathers in the United States with a correlation coefficient (R) of 0.303 and weighted average of 17.1%. Similarly, the statistical analysis conducted on geographies consisting of 230,818,529 people shows a mild positive correlation between the proportion of Immigrants from Ukraine and poverty level among single fathers in the United States with a correlation coefficient (R) of 0.379 and weighted average of 15.4%, a difference of 11.1%.
Single Father Poverty Correlation Summary
| Measurement | Luxembourger | Immigrants from Ukraine |
| Minimum | 14.2% | 2.4% |
| Maximum | 100.0% | 100.0% |
| Range | 85.8% | 97.6% |
| Mean | 40.0% | 25.3% |
| Median | 24.0% | 15.9% |
| Interquartile 25% (IQ1) | 18.0% | 12.7% |
| Interquartile 75% (IQ3) | 58.3% | 22.0% |
| Interquartile Range (IQR) | 40.4% | 9.3% |
| Standard Deviation (Sample) | 29.6% | 26.7% |
| Standard Deviation (Population) | 29.0% | 26.2% |
Similar Demographics by Single Father Poverty
Demographics Similar to Luxembourgers by Single Father Poverty
In terms of single father poverty, the demographic groups most similar to Luxembourgers are Austrian (17.1%, a difference of 0.010%), Croatian (17.1%, a difference of 0.10%), Cree (17.1%, a difference of 0.11%), Canadian (17.1%, a difference of 0.14%), and Greek (17.1%, a difference of 0.18%).
| Demographics | Rating | Rank | Single Father Poverty |
| Hondurans | 1.6 /100 | #244 | Tragic 17.0% |
| Trinidadians and Tobagonians | 1.5 /100 | #245 | Tragic 17.0% |
| Immigrants | Ireland | 1.4 /100 | #246 | Tragic 17.1% |
| Greeks | 1.3 /100 | #247 | Tragic 17.1% |
| Czechoslovakians | 1.3 /100 | #248 | Tragic 17.1% |
| Canadians | 1.3 /100 | #249 | Tragic 17.1% |
| Austrians | 1.1 /100 | #250 | Tragic 17.1% |
| Luxembourgers | 1.1 /100 | #251 | Tragic 17.1% |
| Croatians | 1.0 /100 | #252 | Tragic 17.1% |
| Cree | 1.0 /100 | #253 | Tragic 17.1% |
| Immigrants | Honduras | 0.9 /100 | #254 | Tragic 17.1% |
| Sierra Leoneans | 0.8 /100 | #255 | Tragic 17.2% |
| Immigrants | Haiti | 0.8 /100 | #256 | Tragic 17.2% |
| Immigrants | Albania | 0.7 /100 | #257 | Tragic 17.2% |
| Albanians | 0.7 /100 | #258 | Tragic 17.2% |
Demographics Similar to Immigrants from Ukraine by Single Father Poverty
In terms of single father poverty, the demographic groups most similar to Immigrants from Ukraine are Immigrants from Congo (15.4%, a difference of 0.010%), Armenian (15.4%, a difference of 0.030%), Chinese (15.4%, a difference of 0.090%), Peruvian (15.4%, a difference of 0.22%), and Immigrants from Northern Africa (15.3%, a difference of 0.26%).
| Demographics | Rating | Rank | Single Father Poverty |
| Immigrants | Turkey | 99.5 /100 | #75 | Exceptional 15.3% |
| Immigrants | Japan | 99.5 /100 | #76 | Exceptional 15.3% |
| Immigrants | Peru | 99.5 /100 | #77 | Exceptional 15.3% |
| Tlingit-Haida | 99.5 /100 | #78 | Exceptional 15.3% |
| Immigrants | Northern Africa | 99.5 /100 | #79 | Exceptional 15.3% |
| Armenians | 99.4 /100 | #80 | Exceptional 15.4% |
| Immigrants | Congo | 99.4 /100 | #81 | Exceptional 15.4% |
| Immigrants | Ukraine | 99.4 /100 | #82 | Exceptional 15.4% |
| Chinese | 99.3 /100 | #83 | Exceptional 15.4% |
| Peruvians | 99.2 /100 | #84 | Exceptional 15.4% |
| Immigrants | Oceania | 99.1 /100 | #85 | Exceptional 15.4% |
| Immigrants | Russia | 99.0 /100 | #86 | Exceptional 15.5% |
| Brazilians | 99.0 /100 | #87 | Exceptional 15.5% |
| Burmese | 99.0 /100 | #88 | Exceptional 15.5% |
| Immigrants | Korea | 99.0 /100 | #89 | Exceptional 15.5% |