Immigrants from Trinidad and Tobago vs Bangladeshi Receiving Food Stamps
COMPARE
Immigrants from Trinidad and Tobago
Bangladeshi
Receiving Food Stamps
Receiving Food Stamps Comparison
Immigrants from Trinidad and Tobago
Bangladeshis
15.8%
RECEIVING FOOD STAMPS
0.0/ 100
METRIC RATING
298th/ 347
METRIC RANK
15.0%
RECEIVING FOOD STAMPS
0.0/ 100
METRIC RATING
283rd/ 347
METRIC RANK
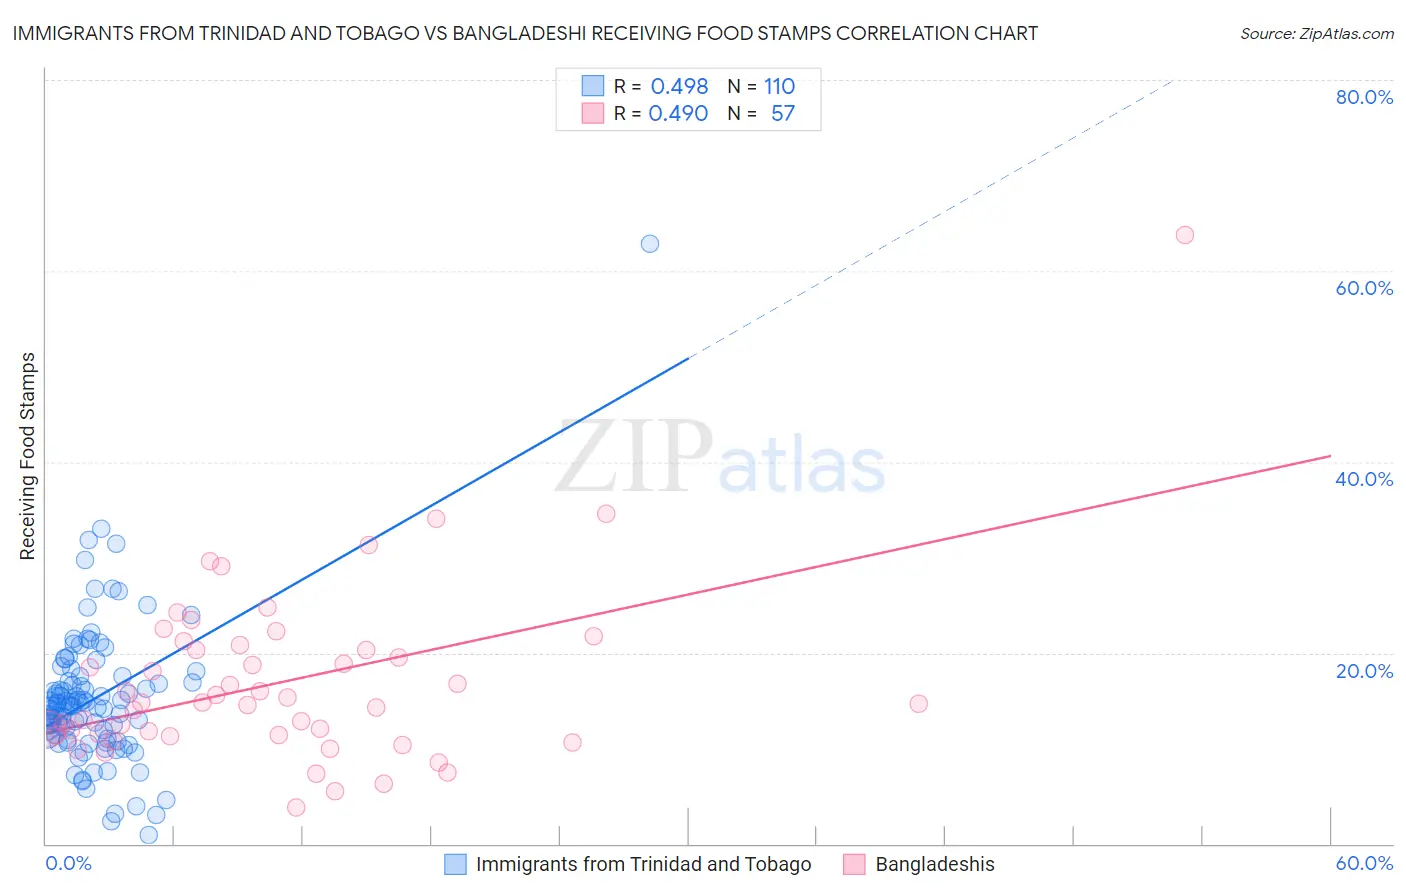
Immigrants from Trinidad and Tobago vs Bangladeshi Receiving Food Stamps Correlation Chart
The statistical analysis conducted on geographies consisting of 223,195,672 people shows a moderate positive correlation between the proportion of Immigrants from Trinidad and Tobago and percentage of population receiving government assistance and/or food stamps in the United States with a correlation coefficient (R) of 0.498 and weighted average of 15.8%. Similarly, the statistical analysis conducted on geographies consisting of 141,258,280 people shows a moderate positive correlation between the proportion of Bangladeshis and percentage of population receiving government assistance and/or food stamps in the United States with a correlation coefficient (R) of 0.490 and weighted average of 15.0%, a difference of 5.0%.
Receiving Food Stamps Correlation Summary
| Measurement | Immigrants from Trinidad and Tobago | Bangladeshi |
| Minimum | 0.90% | 3.8% |
| Maximum | 62.8% | 63.8% |
| Range | 61.9% | 60.0% |
| Mean | 15.2% | 16.9% |
| Median | 14.5% | 14.7% |
| Interquartile 25% (IQ1) | 11.2% | 11.4% |
| Interquartile 75% (IQ3) | 17.5% | 20.6% |
| Interquartile Range (IQR) | 6.3% | 9.2% |
| Standard Deviation (Sample) | 7.6% | 9.4% |
| Standard Deviation (Population) | 7.6% | 9.3% |
Demographics Similar to Immigrants from Trinidad and Tobago and Bangladeshis by Receiving Food Stamps
In terms of receiving food stamps, the demographic groups most similar to Immigrants from Trinidad and Tobago are Immigrants from Bahamas (15.8%, a difference of 0.25%), Hispanic or Latino (15.8%, a difference of 0.28%), Tsimshian (15.7%, a difference of 0.41%), Immigrants from Honduras (15.7%, a difference of 0.42%), and Immigrants from Bangladesh (15.9%, a difference of 0.71%). Similarly, the demographic groups most similar to Bangladeshis are Immigrants from Ecuador (15.0%, a difference of 0.010%), Immigrants from Central America (15.0%, a difference of 0.28%), Immigrants from Liberia (15.1%, a difference of 0.39%), African (15.1%, a difference of 0.53%), and Immigrants from Mexico (15.2%, a difference of 0.76%).
| Demographics | Rating | Rank | Receiving Food Stamps |
| Ecuadorians | 0.0 /100 | #280 | Tragic 14.9% |
| Spanish American Indians | 0.0 /100 | #281 | Tragic 14.9% |
| Immigrants | Central America | 0.0 /100 | #282 | Tragic 15.0% |
| Bangladeshis | 0.0 /100 | #283 | Tragic 15.0% |
| Immigrants | Ecuador | 0.0 /100 | #284 | Tragic 15.0% |
| Immigrants | Liberia | 0.0 /100 | #285 | Tragic 15.1% |
| Africans | 0.0 /100 | #286 | Tragic 15.1% |
| Immigrants | Mexico | 0.0 /100 | #287 | Tragic 15.2% |
| Immigrants | Belize | 0.0 /100 | #288 | Tragic 15.2% |
| Immigrants | Senegal | 0.0 /100 | #289 | Tragic 15.3% |
| Senegalese | 0.0 /100 | #290 | Tragic 15.4% |
| Hondurans | 0.0 /100 | #291 | Tragic 15.5% |
| Alaska Natives | 0.0 /100 | #292 | Tragic 15.6% |
| Vietnamese | 0.0 /100 | #293 | Tragic 15.7% |
| Immigrants | Latin America | 0.0 /100 | #294 | Tragic 15.7% |
| Immigrants | Honduras | 0.0 /100 | #295 | Tragic 15.7% |
| Tsimshian | 0.0 /100 | #296 | Tragic 15.7% |
| Immigrants | Bahamas | 0.0 /100 | #297 | Tragic 15.8% |
| Immigrants | Trinidad and Tobago | 0.0 /100 | #298 | Tragic 15.8% |
| Hispanics or Latinos | 0.0 /100 | #299 | Tragic 15.8% |
| Immigrants | Bangladesh | 0.0 /100 | #300 | Tragic 15.9% |