Immigrants from South Central Asia vs Immigrants from Nigeria Seniors Poverty Over the Age of 75
COMPARE
Immigrants from South Central Asia
Immigrants from Nigeria
Seniors Poverty Over the Age of 75
Seniors Poverty Over the Age of 75 Comparison
Immigrants from South Central Asia
Immigrants from Nigeria
11.4%
SENIORS POVERTY OVER THE AGE OF 75
96.4/ 100
METRIC RATING
70th/ 347
METRIC RANK
13.0%
SENIORS POVERTY OVER THE AGE OF 75
3.3/ 100
METRIC RATING
223rd/ 347
METRIC RANK
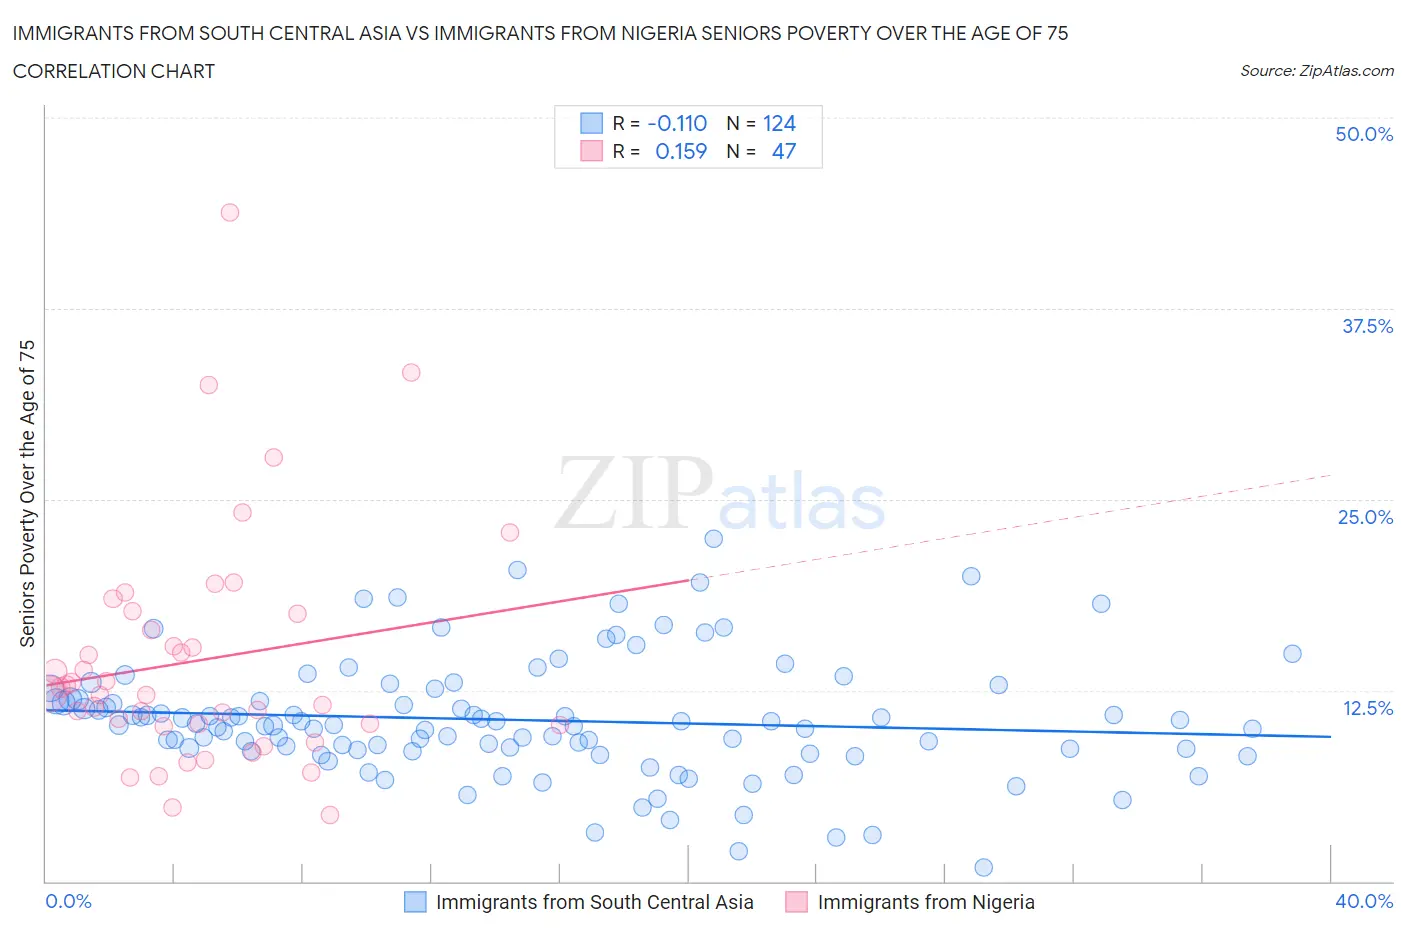
Immigrants from South Central Asia vs Immigrants from Nigeria Seniors Poverty Over the Age of 75 Correlation Chart
The statistical analysis conducted on geographies consisting of 465,487,135 people shows a poor negative correlation between the proportion of Immigrants from South Central Asia and poverty level among seniors over the age of 75 in the United States with a correlation coefficient (R) of -0.110 and weighted average of 11.4%. Similarly, the statistical analysis conducted on geographies consisting of 281,265,931 people shows a poor positive correlation between the proportion of Immigrants from Nigeria and poverty level among seniors over the age of 75 in the United States with a correlation coefficient (R) of 0.159 and weighted average of 13.0%, a difference of 14.5%.
Seniors Poverty Over the Age of 75 Correlation Summary
| Measurement | Immigrants from South Central Asia | Immigrants from Nigeria |
| Minimum | 0.92% | 4.3% |
| Maximum | 22.4% | 43.8% |
| Range | 21.5% | 39.5% |
| Mean | 10.6% | 14.5% |
| Median | 10.2% | 12.2% |
| Interquartile 25% (IQ1) | 8.7% | 10.2% |
| Interquartile 75% (IQ3) | 11.9% | 17.5% |
| Interquartile Range (IQR) | 3.3% | 7.3% |
| Standard Deviation (Sample) | 3.9% | 7.7% |
| Standard Deviation (Population) | 3.8% | 7.6% |
Similar Demographics by Seniors Poverty Over the Age of 75
Demographics Similar to Immigrants from South Central Asia by Seniors Poverty Over the Age of 75
In terms of seniors poverty over the age of 75, the demographic groups most similar to Immigrants from South Central Asia are Ottawa (11.4%, a difference of 0.040%), Immigrants from Austria (11.4%, a difference of 0.050%), Bolivian (11.4%, a difference of 0.070%), Osage (11.4%, a difference of 0.080%), and Estonian (11.4%, a difference of 0.16%).
| Demographics | Rating | Rank | Seniors Poverty Over the Age of 75 |
| Immigrants | Afghanistan | 97.5 /100 | #63 | Exceptional 11.3% |
| Immigrants | Northern Europe | 97.4 /100 | #64 | Exceptional 11.3% |
| Immigrants | Taiwan | 96.7 /100 | #65 | Exceptional 11.4% |
| Estonians | 96.7 /100 | #66 | Exceptional 11.4% |
| Bolivians | 96.5 /100 | #67 | Exceptional 11.4% |
| Immigrants | Austria | 96.5 /100 | #68 | Exceptional 11.4% |
| Ottawa | 96.5 /100 | #69 | Exceptional 11.4% |
| Immigrants | South Central Asia | 96.4 /100 | #70 | Exceptional 11.4% |
| Osage | 96.3 /100 | #71 | Exceptional 11.4% |
| Sierra Leoneans | 96.1 /100 | #72 | Exceptional 11.4% |
| Immigrants | Micronesia | 96.0 /100 | #73 | Exceptional 11.4% |
| Delaware | 96.0 /100 | #74 | Exceptional 11.4% |
| Palestinians | 95.8 /100 | #75 | Exceptional 11.4% |
| French Canadians | 95.7 /100 | #76 | Exceptional 11.4% |
| Whites/Caucasians | 95.5 /100 | #77 | Exceptional 11.4% |
Demographics Similar to Immigrants from Nigeria by Seniors Poverty Over the Age of 75
In terms of seniors poverty over the age of 75, the demographic groups most similar to Immigrants from Nigeria are Nigerian (13.0%, a difference of 0.090%), Chippewa (13.1%, a difference of 0.20%), Immigrants from Morocco (13.1%, a difference of 0.27%), Shoshone (13.1%, a difference of 0.43%), and Immigrants from Kazakhstan (13.0%, a difference of 0.53%).
| Demographics | Rating | Rank | Seniors Poverty Over the Age of 75 |
| Immigrants | Brazil | 5.2 /100 | #216 | Tragic 12.9% |
| Bermudans | 4.9 /100 | #217 | Tragic 12.9% |
| Immigrants | Western Asia | 4.9 /100 | #218 | Tragic 12.9% |
| Ute | 4.7 /100 | #219 | Tragic 12.9% |
| Seminole | 4.5 /100 | #220 | Tragic 12.9% |
| Immigrants | Kazakhstan | 4.3 /100 | #221 | Tragic 13.0% |
| Nigerians | 3.4 /100 | #222 | Tragic 13.0% |
| Immigrants | Nigeria | 3.3 /100 | #223 | Tragic 13.0% |
| Chippewa | 2.9 /100 | #224 | Tragic 13.1% |
| Immigrants | Morocco | 2.8 /100 | #225 | Tragic 13.1% |
| Shoshone | 2.6 /100 | #226 | Tragic 13.1% |
| Cree | 2.3 /100 | #227 | Tragic 13.1% |
| Israelis | 2.0 /100 | #228 | Tragic 13.2% |
| Somalis | 1.6 /100 | #229 | Tragic 13.2% |
| Immigrants | China | 1.5 /100 | #230 | Tragic 13.2% |