New Zealander vs Immigrants from Nigeria Seniors Poverty Over the Age of 75
COMPARE
New Zealander
Immigrants from Nigeria
Seniors Poverty Over the Age of 75
Seniors Poverty Over the Age of 75 Comparison
New Zealanders
Immigrants from Nigeria
11.7%
SENIORS POVERTY OVER THE AGE OF 75
86.3/ 100
METRIC RATING
115th/ 347
METRIC RANK
13.0%
SENIORS POVERTY OVER THE AGE OF 75
3.3/ 100
METRIC RATING
223rd/ 347
METRIC RANK
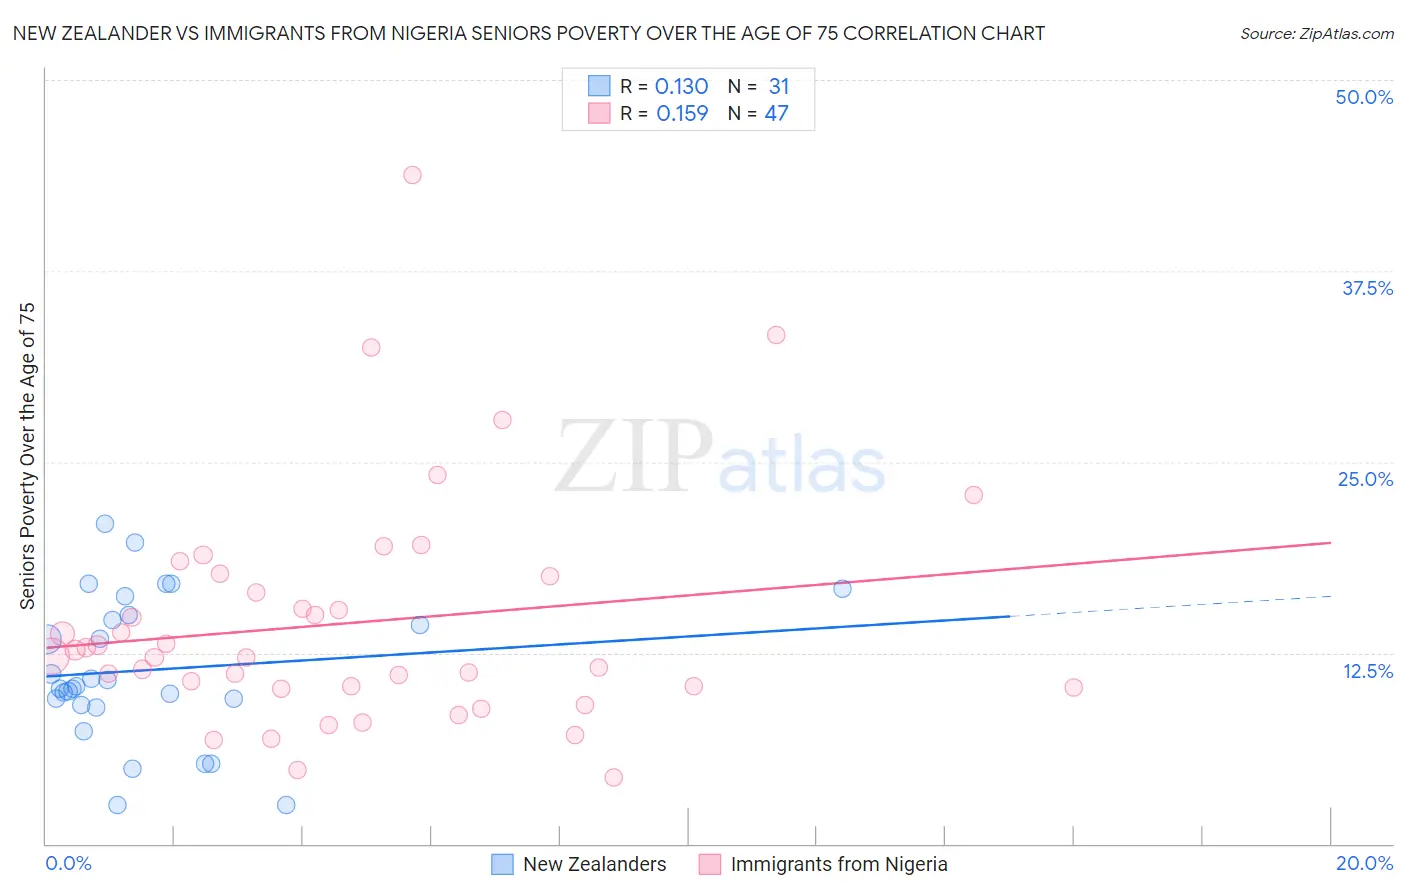
New Zealander vs Immigrants from Nigeria Seniors Poverty Over the Age of 75 Correlation Chart
The statistical analysis conducted on geographies consisting of 106,459,325 people shows a poor positive correlation between the proportion of New Zealanders and poverty level among seniors over the age of 75 in the United States with a correlation coefficient (R) of 0.130 and weighted average of 11.7%. Similarly, the statistical analysis conducted on geographies consisting of 281,265,931 people shows a poor positive correlation between the proportion of Immigrants from Nigeria and poverty level among seniors over the age of 75 in the United States with a correlation coefficient (R) of 0.159 and weighted average of 13.0%, a difference of 11.1%.
Seniors Poverty Over the Age of 75 Correlation Summary
| Measurement | New Zealander | Immigrants from Nigeria |
| Minimum | 2.5% | 4.3% |
| Maximum | 20.9% | 43.8% |
| Range | 18.4% | 39.5% |
| Mean | 11.4% | 14.5% |
| Median | 10.3% | 12.2% |
| Interquartile 25% (IQ1) | 9.1% | 10.2% |
| Interquartile 75% (IQ3) | 15.0% | 17.5% |
| Interquartile Range (IQR) | 5.9% | 7.3% |
| Standard Deviation (Sample) | 4.7% | 7.7% |
| Standard Deviation (Population) | 4.6% | 7.6% |
Similar Demographics by Seniors Poverty Over the Age of 75
Demographics Similar to New Zealanders by Seniors Poverty Over the Age of 75
In terms of seniors poverty over the age of 75, the demographic groups most similar to New Zealanders are Iraqi (11.7%, a difference of 0.0%), Ukrainian (11.7%, a difference of 0.10%), Immigrants from Czechoslovakia (11.7%, a difference of 0.11%), Icelander (11.7%, a difference of 0.11%), and Immigrants from Zimbabwe (11.7%, a difference of 0.14%).
| Demographics | Rating | Rank | Seniors Poverty Over the Age of 75 |
| Turks | 89.4 /100 | #108 | Excellent 11.7% |
| South Africans | 89.3 /100 | #109 | Excellent 11.7% |
| Immigrants | Jordan | 88.7 /100 | #110 | Excellent 11.7% |
| Burmese | 88.7 /100 | #111 | Excellent 11.7% |
| Immigrants | Bolivia | 88.4 /100 | #112 | Excellent 11.7% |
| Immigrants | Czechoslovakia | 87.0 /100 | #113 | Excellent 11.7% |
| Ukrainians | 86.9 /100 | #114 | Excellent 11.7% |
| New Zealanders | 86.3 /100 | #115 | Excellent 11.7% |
| Iraqis | 86.3 /100 | #116 | Excellent 11.7% |
| Icelanders | 85.7 /100 | #117 | Excellent 11.7% |
| Immigrants | Zimbabwe | 85.5 /100 | #118 | Excellent 11.7% |
| Immigrants | Uganda | 84.8 /100 | #119 | Excellent 11.8% |
| Immigrants | Nepal | 84.5 /100 | #120 | Excellent 11.8% |
| Malaysians | 84.1 /100 | #121 | Excellent 11.8% |
| Pakistanis | 84.0 /100 | #122 | Excellent 11.8% |
Demographics Similar to Immigrants from Nigeria by Seniors Poverty Over the Age of 75
In terms of seniors poverty over the age of 75, the demographic groups most similar to Immigrants from Nigeria are Nigerian (13.0%, a difference of 0.090%), Chippewa (13.1%, a difference of 0.20%), Immigrants from Morocco (13.1%, a difference of 0.27%), Shoshone (13.1%, a difference of 0.43%), and Immigrants from Kazakhstan (13.0%, a difference of 0.53%).
| Demographics | Rating | Rank | Seniors Poverty Over the Age of 75 |
| Immigrants | Brazil | 5.2 /100 | #216 | Tragic 12.9% |
| Bermudans | 4.9 /100 | #217 | Tragic 12.9% |
| Immigrants | Western Asia | 4.9 /100 | #218 | Tragic 12.9% |
| Ute | 4.7 /100 | #219 | Tragic 12.9% |
| Seminole | 4.5 /100 | #220 | Tragic 12.9% |
| Immigrants | Kazakhstan | 4.3 /100 | #221 | Tragic 13.0% |
| Nigerians | 3.4 /100 | #222 | Tragic 13.0% |
| Immigrants | Nigeria | 3.3 /100 | #223 | Tragic 13.0% |
| Chippewa | 2.9 /100 | #224 | Tragic 13.1% |
| Immigrants | Morocco | 2.8 /100 | #225 | Tragic 13.1% |
| Shoshone | 2.6 /100 | #226 | Tragic 13.1% |
| Cree | 2.3 /100 | #227 | Tragic 13.1% |
| Israelis | 2.0 /100 | #228 | Tragic 13.2% |
| Somalis | 1.6 /100 | #229 | Tragic 13.2% |
| Immigrants | China | 1.5 /100 | #230 | Tragic 13.2% |