Malaysian vs Immigrants from Nigeria Seniors Poverty Over the Age of 75
COMPARE
Malaysian
Immigrants from Nigeria
Seniors Poverty Over the Age of 75
Seniors Poverty Over the Age of 75 Comparison
Malaysians
Immigrants from Nigeria
11.8%
SENIORS POVERTY OVER THE AGE OF 75
84.1/ 100
METRIC RATING
121st/ 347
METRIC RANK
13.0%
SENIORS POVERTY OVER THE AGE OF 75
3.3/ 100
METRIC RATING
223rd/ 347
METRIC RANK
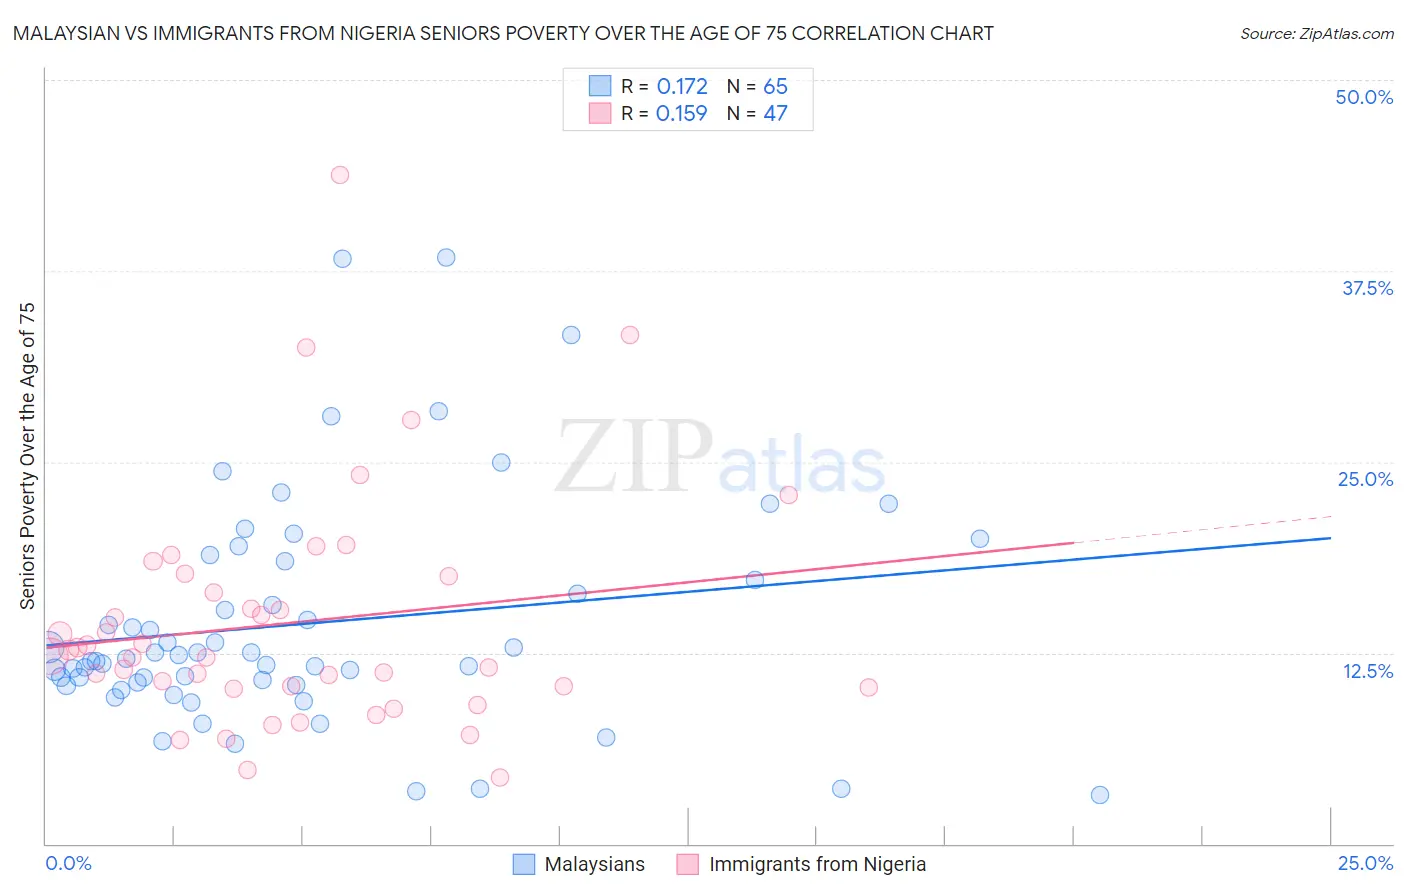
Malaysian vs Immigrants from Nigeria Seniors Poverty Over the Age of 75 Correlation Chart
The statistical analysis conducted on geographies consisting of 224,603,376 people shows a poor positive correlation between the proportion of Malaysians and poverty level among seniors over the age of 75 in the United States with a correlation coefficient (R) of 0.172 and weighted average of 11.8%. Similarly, the statistical analysis conducted on geographies consisting of 281,265,931 people shows a poor positive correlation between the proportion of Immigrants from Nigeria and poverty level among seniors over the age of 75 in the United States with a correlation coefficient (R) of 0.159 and weighted average of 13.0%, a difference of 10.6%.
Seniors Poverty Over the Age of 75 Correlation Summary
| Measurement | Malaysian | Immigrants from Nigeria |
| Minimum | 3.2% | 4.3% |
| Maximum | 38.4% | 43.8% |
| Range | 35.2% | 39.5% |
| Mean | 14.4% | 14.5% |
| Median | 12.1% | 12.2% |
| Interquartile 25% (IQ1) | 10.5% | 10.2% |
| Interquartile 75% (IQ3) | 17.9% | 17.5% |
| Interquartile Range (IQR) | 7.4% | 7.3% |
| Standard Deviation (Sample) | 7.4% | 7.7% |
| Standard Deviation (Population) | 7.4% | 7.6% |
Similar Demographics by Seniors Poverty Over the Age of 75
Demographics Similar to Malaysians by Seniors Poverty Over the Age of 75
In terms of seniors poverty over the age of 75, the demographic groups most similar to Malaysians are Pakistani (11.8%, a difference of 0.010%), Immigrants from Italy (11.8%, a difference of 0.010%), Fijian (11.8%, a difference of 0.040%), Sudanese (11.8%, a difference of 0.070%), and Immigrants from Nepal (11.8%, a difference of 0.080%).
| Demographics | Rating | Rank | Seniors Poverty Over the Age of 75 |
| Ukrainians | 86.9 /100 | #114 | Excellent 11.7% |
| New Zealanders | 86.3 /100 | #115 | Excellent 11.7% |
| Iraqis | 86.3 /100 | #116 | Excellent 11.7% |
| Icelanders | 85.7 /100 | #117 | Excellent 11.7% |
| Immigrants | Zimbabwe | 85.5 /100 | #118 | Excellent 11.7% |
| Immigrants | Uganda | 84.8 /100 | #119 | Excellent 11.8% |
| Immigrants | Nepal | 84.5 /100 | #120 | Excellent 11.8% |
| Malaysians | 84.1 /100 | #121 | Excellent 11.8% |
| Pakistanis | 84.0 /100 | #122 | Excellent 11.8% |
| Immigrants | Italy | 84.0 /100 | #123 | Excellent 11.8% |
| Fijians | 83.8 /100 | #124 | Excellent 11.8% |
| Sudanese | 83.6 /100 | #125 | Excellent 11.8% |
| Pennsylvania Germans | 83.4 /100 | #126 | Excellent 11.8% |
| Immigrants | Denmark | 82.6 /100 | #127 | Excellent 11.8% |
| Immigrants | Hungary | 81.7 /100 | #128 | Excellent 11.8% |
Demographics Similar to Immigrants from Nigeria by Seniors Poverty Over the Age of 75
In terms of seniors poverty over the age of 75, the demographic groups most similar to Immigrants from Nigeria are Nigerian (13.0%, a difference of 0.090%), Chippewa (13.1%, a difference of 0.20%), Immigrants from Morocco (13.1%, a difference of 0.27%), Shoshone (13.1%, a difference of 0.43%), and Immigrants from Kazakhstan (13.0%, a difference of 0.53%).
| Demographics | Rating | Rank | Seniors Poverty Over the Age of 75 |
| Immigrants | Brazil | 5.2 /100 | #216 | Tragic 12.9% |
| Bermudans | 4.9 /100 | #217 | Tragic 12.9% |
| Immigrants | Western Asia | 4.9 /100 | #218 | Tragic 12.9% |
| Ute | 4.7 /100 | #219 | Tragic 12.9% |
| Seminole | 4.5 /100 | #220 | Tragic 12.9% |
| Immigrants | Kazakhstan | 4.3 /100 | #221 | Tragic 13.0% |
| Nigerians | 3.4 /100 | #222 | Tragic 13.0% |
| Immigrants | Nigeria | 3.3 /100 | #223 | Tragic 13.0% |
| Chippewa | 2.9 /100 | #224 | Tragic 13.1% |
| Immigrants | Morocco | 2.8 /100 | #225 | Tragic 13.1% |
| Shoshone | 2.6 /100 | #226 | Tragic 13.1% |
| Cree | 2.3 /100 | #227 | Tragic 13.1% |
| Israelis | 2.0 /100 | #228 | Tragic 13.2% |
| Somalis | 1.6 /100 | #229 | Tragic 13.2% |
| Immigrants | China | 1.5 /100 | #230 | Tragic 13.2% |