Lumbee vs Immigrants from Belarus Seniors Poverty Over the Age of 75
COMPARE
Lumbee
Immigrants from Belarus
Seniors Poverty Over the Age of 75
Seniors Poverty Over the Age of 75 Comparison
Lumbee
Immigrants from Belarus
19.7%
SENIORS POVERTY OVER THE AGE OF 75
0.0/ 100
METRIC RATING
343rd/ 347
METRIC RANK
13.8%
SENIORS POVERTY OVER THE AGE OF 75
0.2/ 100
METRIC RATING
255th/ 347
METRIC RANK
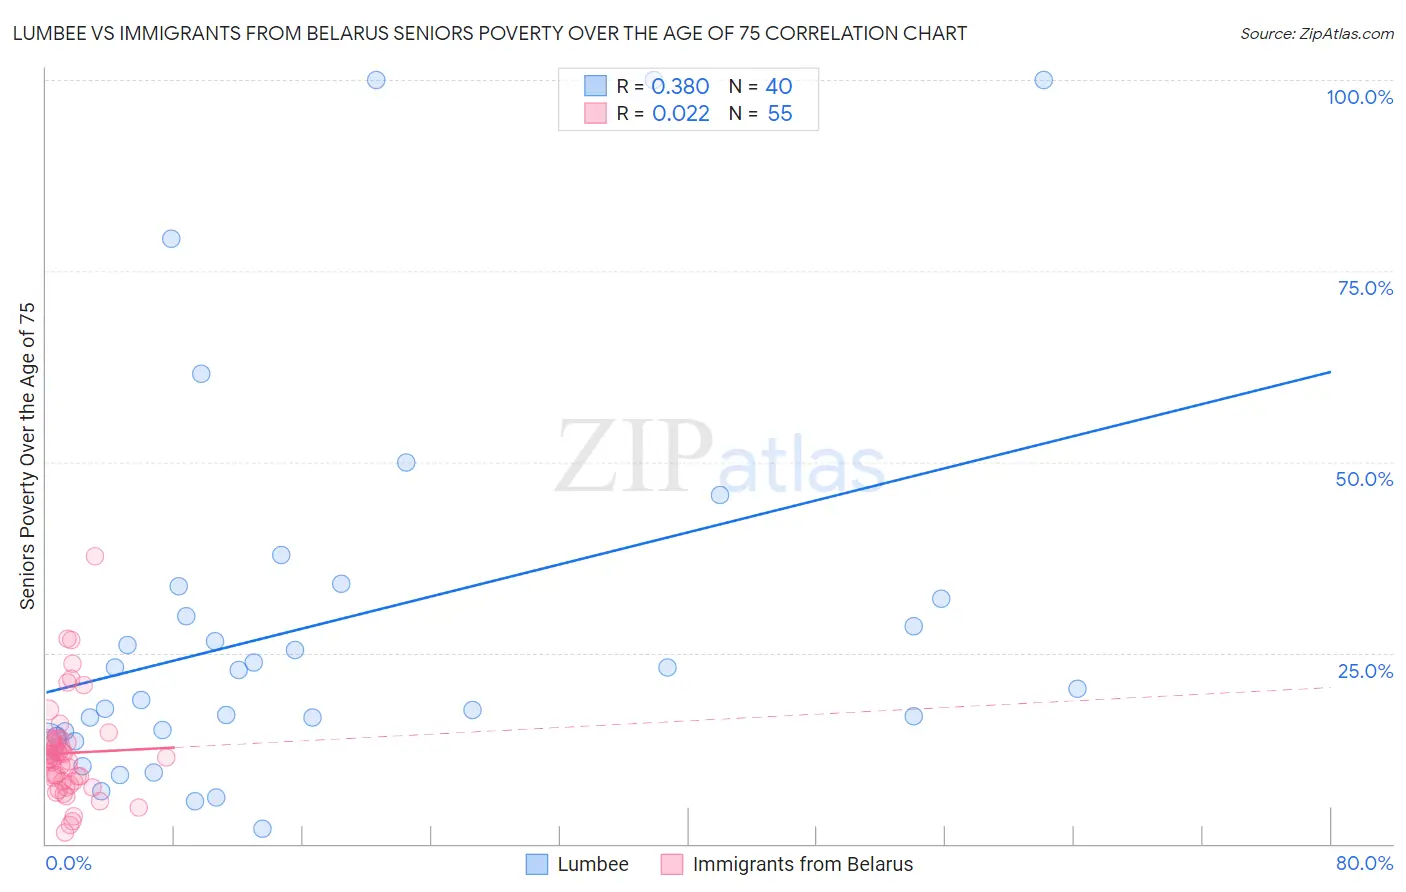
Lumbee vs Immigrants from Belarus Seniors Poverty Over the Age of 75 Correlation Chart
The statistical analysis conducted on geographies consisting of 91,707,280 people shows a mild positive correlation between the proportion of Lumbee and poverty level among seniors over the age of 75 in the United States with a correlation coefficient (R) of 0.380 and weighted average of 19.7%. Similarly, the statistical analysis conducted on geographies consisting of 149,396,429 people shows no correlation between the proportion of Immigrants from Belarus and poverty level among seniors over the age of 75 in the United States with a correlation coefficient (R) of 0.022 and weighted average of 13.8%, a difference of 43.4%.
Seniors Poverty Over the Age of 75 Correlation Summary
| Measurement | Lumbee | Immigrants from Belarus |
| Minimum | 2.0% | 1.5% |
| Maximum | 100.0% | 37.7% |
| Range | 98.0% | 36.2% |
| Mean | 29.1% | 11.9% |
| Median | 21.5% | 11.1% |
| Interquartile 25% (IQ1) | 14.4% | 8.1% |
| Interquartile 75% (IQ3) | 32.9% | 13.4% |
| Interquartile Range (IQR) | 18.5% | 5.3% |
| Standard Deviation (Sample) | 25.5% | 6.5% |
| Standard Deviation (Population) | 25.2% | 6.4% |
Similar Demographics by Seniors Poverty Over the Age of 75
Demographics Similar to Lumbee by Seniors Poverty Over the Age of 75
In terms of seniors poverty over the age of 75, the demographic groups most similar to Lumbee are Dominican (19.6%, a difference of 0.66%), Immigrants from Cuba (19.9%, a difference of 0.79%), Immigrants from Dominican Republic (20.1%, a difference of 1.6%), Navajo (19.4%, a difference of 1.9%), and Tohono O'odham (19.1%, a difference of 3.2%).
| Demographics | Rating | Rank | Seniors Poverty Over the Age of 75 |
| Immigrants | Nicaragua | 0.0 /100 | #333 | Tragic 17.6% |
| Immigrants | Grenada | 0.0 /100 | #334 | Tragic 17.8% |
| Cubans | 0.0 /100 | #335 | Tragic 18.0% |
| Immigrants | Caribbean | 0.0 /100 | #336 | Tragic 18.2% |
| Yakama | 0.0 /100 | #337 | Tragic 18.3% |
| Immigrants | Cabo Verde | 0.0 /100 | #338 | Tragic 18.5% |
| Hopi | 0.0 /100 | #339 | Tragic 18.9% |
| Tohono O'odham | 0.0 /100 | #340 | Tragic 19.1% |
| Navajo | 0.0 /100 | #341 | Tragic 19.4% |
| Dominicans | 0.0 /100 | #342 | Tragic 19.6% |
| Lumbee | 0.0 /100 | #343 | Tragic 19.7% |
| Immigrants | Cuba | 0.0 /100 | #344 | Tragic 19.9% |
| Immigrants | Dominican Republic | 0.0 /100 | #345 | Tragic 20.1% |
| Puerto Ricans | 0.0 /100 | #346 | Tragic 23.2% |
| Pima | 0.0 /100 | #347 | Tragic 23.9% |
Demographics Similar to Immigrants from Belarus by Seniors Poverty Over the Age of 75
In terms of seniors poverty over the age of 75, the demographic groups most similar to Immigrants from Belarus are Blackfeet (13.7%, a difference of 0.43%), Inupiat (13.8%, a difference of 0.50%), Immigrants from Spain (13.7%, a difference of 0.54%), Immigrants from Argentina (13.7%, a difference of 0.76%), and Immigrants from Peru (13.7%, a difference of 0.81%).
| Demographics | Rating | Rank | Seniors Poverty Over the Age of 75 |
| Africans | 0.3 /100 | #248 | Tragic 13.6% |
| Immigrants | Albania | 0.3 /100 | #249 | Tragic 13.6% |
| Mexican American Indians | 0.3 /100 | #250 | Tragic 13.6% |
| Immigrants | Peru | 0.3 /100 | #251 | Tragic 13.7% |
| Immigrants | Argentina | 0.3 /100 | #252 | Tragic 13.7% |
| Immigrants | Spain | 0.2 /100 | #253 | Tragic 13.7% |
| Blackfeet | 0.2 /100 | #254 | Tragic 13.7% |
| Immigrants | Belarus | 0.2 /100 | #255 | Tragic 13.8% |
| Inupiat | 0.1 /100 | #256 | Tragic 13.8% |
| Immigrants | Western Africa | 0.1 /100 | #257 | Tragic 13.9% |
| Immigrants | Panama | 0.1 /100 | #258 | Tragic 13.9% |
| Immigrants | Portugal | 0.1 /100 | #259 | Tragic 13.9% |
| Immigrants | Immigrants | 0.1 /100 | #260 | Tragic 13.9% |
| Ghanaians | 0.1 /100 | #261 | Tragic 14.0% |
| Cajuns | 0.1 /100 | #262 | Tragic 14.0% |