Immigrants from Belgium vs Immigrants from Sudan Child Poverty Under the Age of 16
COMPARE
Immigrants from Belgium
Immigrants from Sudan
Child Poverty Under the Age of 16
Child Poverty Under the Age of 16 Comparison
Immigrants from Belgium
Immigrants from Sudan
14.1%
CHILD POVERTY UNDER THE AGE OF 16
98.6/ 100
METRIC RATING
57th/ 347
METRIC RANK
18.5%
CHILD POVERTY UNDER THE AGE OF 16
0.8/ 100
METRIC RATING
239th/ 347
METRIC RANK
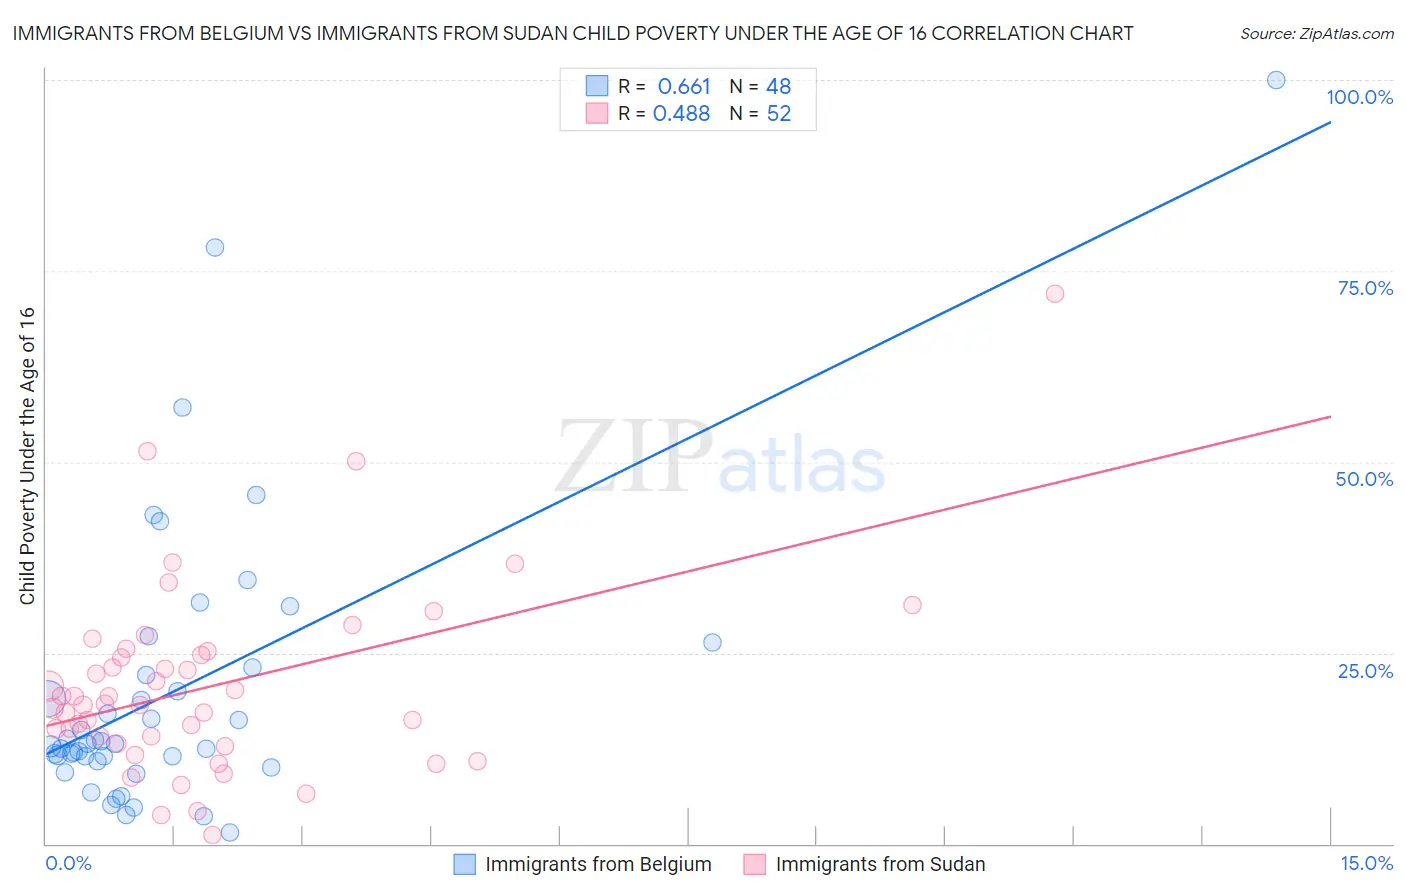
Immigrants from Belgium vs Immigrants from Sudan Child Poverty Under the Age of 16 Correlation Chart
The statistical analysis conducted on geographies consisting of 145,943,045 people shows a significant positive correlation between the proportion of Immigrants from Belgium and poverty level among children under the age of 16 in the United States with a correlation coefficient (R) of 0.661 and weighted average of 14.1%. Similarly, the statistical analysis conducted on geographies consisting of 118,788,059 people shows a moderate positive correlation between the proportion of Immigrants from Sudan and poverty level among children under the age of 16 in the United States with a correlation coefficient (R) of 0.488 and weighted average of 18.5%, a difference of 31.3%.
Child Poverty Under the Age of 16 Correlation Summary
| Measurement | Immigrants from Belgium | Immigrants from Sudan |
| Minimum | 1.6% | 1.2% |
| Maximum | 100.0% | 71.9% |
| Range | 98.4% | 70.7% |
| Mean | 20.0% | 20.7% |
| Median | 13.1% | 18.2% |
| Interquartile 25% (IQ1) | 11.1% | 13.5% |
| Interquartile 75% (IQ3) | 22.5% | 25.0% |
| Interquartile Range (IQR) | 11.5% | 11.4% |
| Standard Deviation (Sample) | 18.9% | 12.5% |
| Standard Deviation (Population) | 18.7% | 12.4% |
Similar Demographics by Child Poverty Under the Age of 16
Demographics Similar to Immigrants from Belgium by Child Poverty Under the Age of 16
In terms of child poverty under the age of 16, the demographic groups most similar to Immigrants from Belgium are Immigrants from Pakistan (14.1%, a difference of 0.020%), Scandinavian (14.1%, a difference of 0.030%), Immigrants from Serbia (14.1%, a difference of 0.090%), Immigrants from Austria (14.2%, a difference of 0.22%), and Immigrants from Indonesia (14.1%, a difference of 0.26%).
| Demographics | Rating | Rank | Child Poverty Under the Age of 16 |
| Immigrants | Czechoslovakia | 99.1 /100 | #50 | Exceptional 13.9% |
| Immigrants | Greece | 99.1 /100 | #51 | Exceptional 13.9% |
| Poles | 98.9 /100 | #52 | Exceptional 14.0% |
| Immigrants | Israel | 98.8 /100 | #53 | Exceptional 14.1% |
| Tsimshian | 98.8 /100 | #54 | Exceptional 14.1% |
| Immigrants | Indonesia | 98.7 /100 | #55 | Exceptional 14.1% |
| Immigrants | Serbia | 98.7 /100 | #56 | Exceptional 14.1% |
| Immigrants | Belgium | 98.6 /100 | #57 | Exceptional 14.1% |
| Immigrants | Pakistan | 98.6 /100 | #58 | Exceptional 14.1% |
| Scandinavians | 98.6 /100 | #59 | Exceptional 14.1% |
| Immigrants | Austria | 98.5 /100 | #60 | Exceptional 14.2% |
| Immigrants | Sweden | 98.5 /100 | #61 | Exceptional 14.2% |
| Zimbabweans | 98.5 /100 | #62 | Exceptional 14.2% |
| Immigrants | Europe | 98.4 /100 | #63 | Exceptional 14.2% |
| Immigrants | Romania | 98.3 /100 | #64 | Exceptional 14.2% |
Demographics Similar to Immigrants from Sudan by Child Poverty Under the Age of 16
In terms of child poverty under the age of 16, the demographic groups most similar to Immigrants from Sudan are Immigrants from Eritrea (18.5%, a difference of 0.040%), Ghanaian (18.6%, a difference of 0.050%), Sudanese (18.5%, a difference of 0.28%), Cree (18.5%, a difference of 0.31%), and Alsatian (18.6%, a difference of 0.51%).
| Demographics | Rating | Rank | Child Poverty Under the Age of 16 |
| Americans | 1.2 /100 | #232 | Tragic 18.3% |
| Fijians | 1.1 /100 | #233 | Tragic 18.4% |
| Immigrants | Nigeria | 1.0 /100 | #234 | Tragic 18.4% |
| Nigerians | 1.0 /100 | #235 | Tragic 18.4% |
| Cree | 0.9 /100 | #236 | Tragic 18.5% |
| Sudanese | 0.9 /100 | #237 | Tragic 18.5% |
| Immigrants | Eritrea | 0.8 /100 | #238 | Tragic 18.5% |
| Immigrants | Sudan | 0.8 /100 | #239 | Tragic 18.5% |
| Ghanaians | 0.8 /100 | #240 | Tragic 18.6% |
| Alsatians | 0.7 /100 | #241 | Tragic 18.6% |
| Immigrants | Laos | 0.6 /100 | #242 | Tragic 18.7% |
| Immigrants | Cuba | 0.6 /100 | #243 | Tragic 18.7% |
| Cape Verdeans | 0.6 /100 | #244 | Tragic 18.7% |
| Shoshone | 0.5 /100 | #245 | Tragic 18.8% |
| Immigrants | Nicaragua | 0.4 /100 | #246 | Tragic 18.8% |