Immigrants from Europe vs Immigrants from Sudan Child Poverty Under the Age of 16
COMPARE
Immigrants from Europe
Immigrants from Sudan
Child Poverty Under the Age of 16
Child Poverty Under the Age of 16 Comparison
Immigrants from Europe
Immigrants from Sudan
14.2%
CHILD POVERTY UNDER THE AGE OF 16
98.4/ 100
METRIC RATING
63rd/ 347
METRIC RANK
18.5%
CHILD POVERTY UNDER THE AGE OF 16
0.8/ 100
METRIC RATING
239th/ 347
METRIC RANK
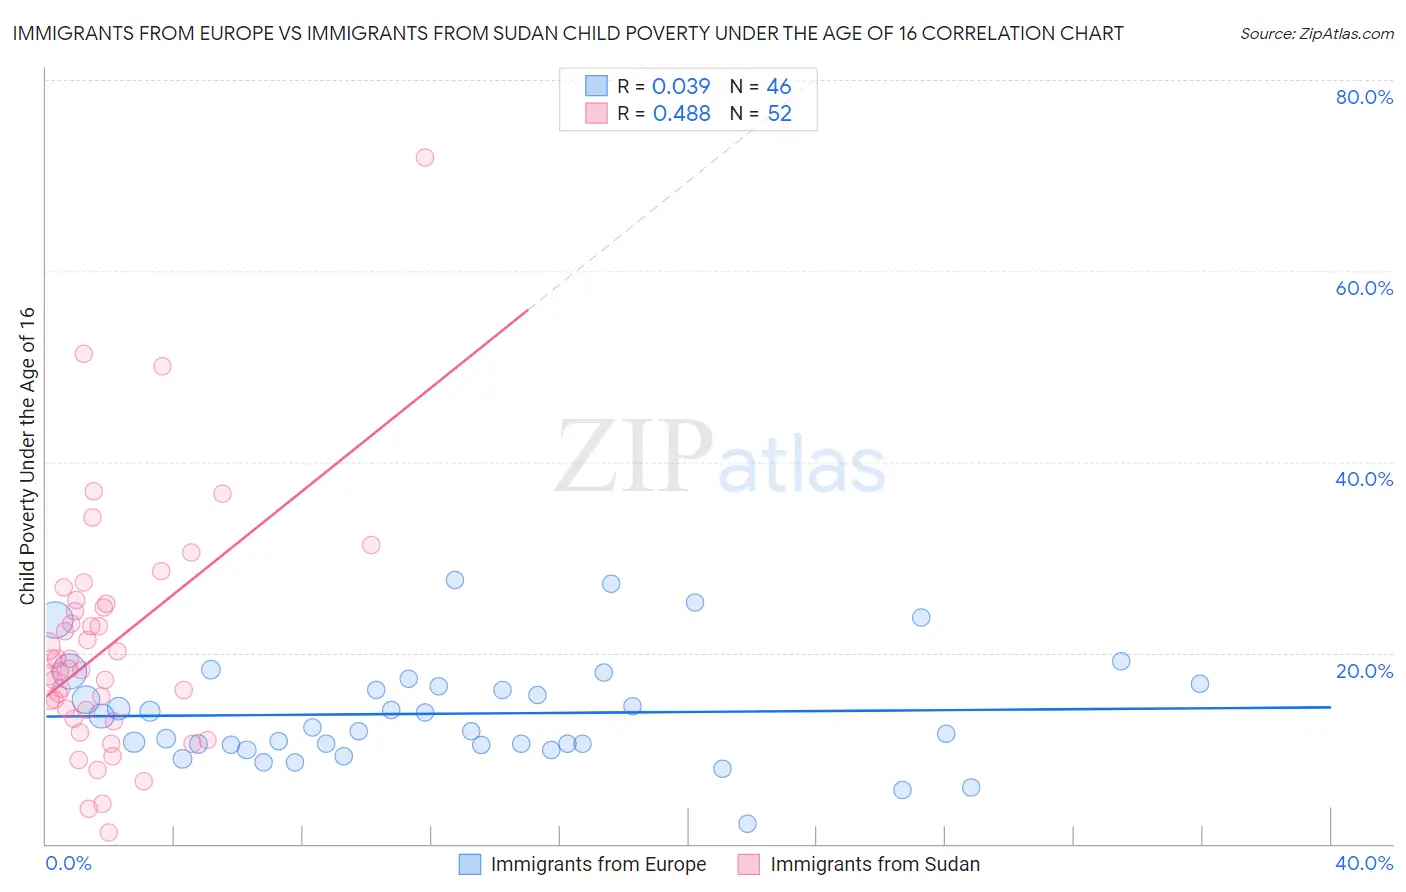
Immigrants from Europe vs Immigrants from Sudan Child Poverty Under the Age of 16 Correlation Chart
The statistical analysis conducted on geographies consisting of 536,681,796 people shows no correlation between the proportion of Immigrants from Europe and poverty level among children under the age of 16 in the United States with a correlation coefficient (R) of 0.039 and weighted average of 14.2%. Similarly, the statistical analysis conducted on geographies consisting of 118,788,059 people shows a moderate positive correlation between the proportion of Immigrants from Sudan and poverty level among children under the age of 16 in the United States with a correlation coefficient (R) of 0.488 and weighted average of 18.5%, a difference of 30.5%.
Child Poverty Under the Age of 16 Correlation Summary
| Measurement | Immigrants from Europe | Immigrants from Sudan |
| Minimum | 2.1% | 1.2% |
| Maximum | 27.6% | 71.9% |
| Range | 25.5% | 70.7% |
| Mean | 13.6% | 20.7% |
| Median | 12.0% | 18.2% |
| Interquartile 25% (IQ1) | 10.4% | 13.5% |
| Interquartile 75% (IQ3) | 16.5% | 25.0% |
| Interquartile Range (IQR) | 6.1% | 11.4% |
| Standard Deviation (Sample) | 5.5% | 12.5% |
| Standard Deviation (Population) | 5.5% | 12.4% |
Similar Demographics by Child Poverty Under the Age of 16
Demographics Similar to Immigrants from Europe by Child Poverty Under the Age of 16
In terms of child poverty under the age of 16, the demographic groups most similar to Immigrants from Europe are Immigrants from Romania (14.2%, a difference of 0.13%), Zimbabwean (14.2%, a difference of 0.31%), Immigrants from Sweden (14.2%, a difference of 0.32%), Immigrants from Austria (14.2%, a difference of 0.36%), and Immigrants from Philippines (14.3%, a difference of 0.39%).
| Demographics | Rating | Rank | Child Poverty Under the Age of 16 |
| Immigrants | Serbia | 98.7 /100 | #56 | Exceptional 14.1% |
| Immigrants | Belgium | 98.6 /100 | #57 | Exceptional 14.1% |
| Immigrants | Pakistan | 98.6 /100 | #58 | Exceptional 14.1% |
| Scandinavians | 98.6 /100 | #59 | Exceptional 14.1% |
| Immigrants | Austria | 98.5 /100 | #60 | Exceptional 14.2% |
| Immigrants | Sweden | 98.5 /100 | #61 | Exceptional 14.2% |
| Zimbabweans | 98.5 /100 | #62 | Exceptional 14.2% |
| Immigrants | Europe | 98.4 /100 | #63 | Exceptional 14.2% |
| Immigrants | Romania | 98.3 /100 | #64 | Exceptional 14.2% |
| Immigrants | Philippines | 98.2 /100 | #65 | Exceptional 14.3% |
| Slovenes | 98.1 /100 | #66 | Exceptional 14.3% |
| Europeans | 98.1 /100 | #67 | Exceptional 14.3% |
| Laotians | 98.0 /100 | #68 | Exceptional 14.3% |
| Immigrants | Bulgaria | 98.0 /100 | #69 | Exceptional 14.3% |
| Immigrants | Netherlands | 97.9 /100 | #70 | Exceptional 14.3% |
Demographics Similar to Immigrants from Sudan by Child Poverty Under the Age of 16
In terms of child poverty under the age of 16, the demographic groups most similar to Immigrants from Sudan are Immigrants from Eritrea (18.5%, a difference of 0.040%), Ghanaian (18.6%, a difference of 0.050%), Sudanese (18.5%, a difference of 0.28%), Cree (18.5%, a difference of 0.31%), and Alsatian (18.6%, a difference of 0.51%).
| Demographics | Rating | Rank | Child Poverty Under the Age of 16 |
| Americans | 1.2 /100 | #232 | Tragic 18.3% |
| Fijians | 1.1 /100 | #233 | Tragic 18.4% |
| Immigrants | Nigeria | 1.0 /100 | #234 | Tragic 18.4% |
| Nigerians | 1.0 /100 | #235 | Tragic 18.4% |
| Cree | 0.9 /100 | #236 | Tragic 18.5% |
| Sudanese | 0.9 /100 | #237 | Tragic 18.5% |
| Immigrants | Eritrea | 0.8 /100 | #238 | Tragic 18.5% |
| Immigrants | Sudan | 0.8 /100 | #239 | Tragic 18.5% |
| Ghanaians | 0.8 /100 | #240 | Tragic 18.6% |
| Alsatians | 0.7 /100 | #241 | Tragic 18.6% |
| Immigrants | Laos | 0.6 /100 | #242 | Tragic 18.7% |
| Immigrants | Cuba | 0.6 /100 | #243 | Tragic 18.7% |
| Cape Verdeans | 0.6 /100 | #244 | Tragic 18.7% |
| Shoshone | 0.5 /100 | #245 | Tragic 18.8% |
| Immigrants | Nicaragua | 0.4 /100 | #246 | Tragic 18.8% |