Lithuanian vs Immigrants from Congo Single Mother Households
COMPARE
Lithuanian
Immigrants from Congo
Single Mother Households
Single Mother Households Comparison
Lithuanians
Immigrants from Congo
5.4%
SINGLE MOTHER HOUSEHOLDS
99.4/ 100
METRIC RATING
44th/ 347
METRIC RANK
8.1%
SINGLE MOTHER HOUSEHOLDS
0.0/ 100
METRIC RATING
311th/ 347
METRIC RANK
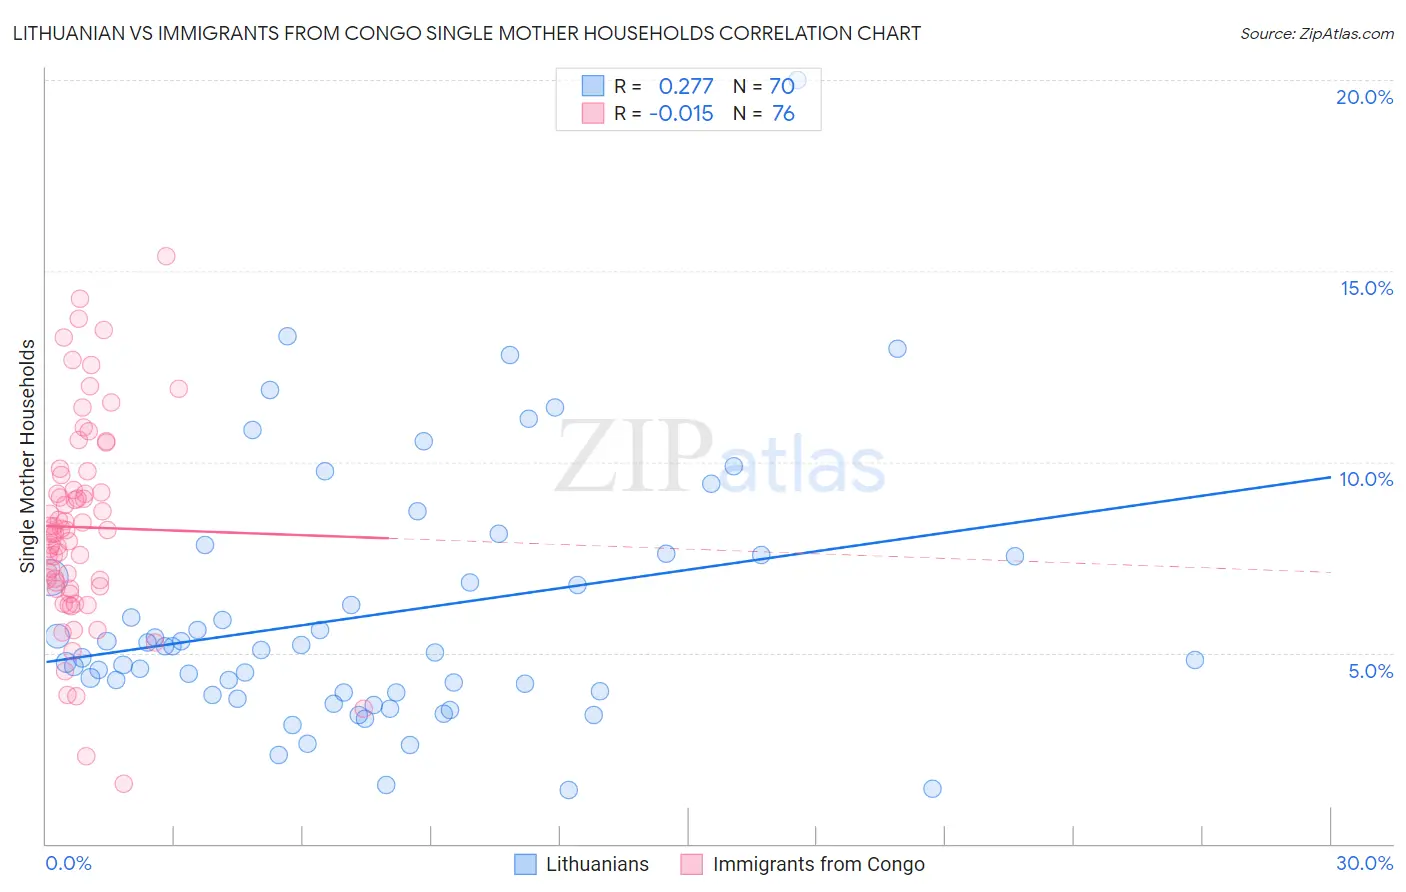
Lithuanian vs Immigrants from Congo Single Mother Households Correlation Chart
The statistical analysis conducted on geographies consisting of 420,116,191 people shows a weak positive correlation between the proportion of Lithuanians and percentage of single mother households in the United States with a correlation coefficient (R) of 0.277 and weighted average of 5.4%. Similarly, the statistical analysis conducted on geographies consisting of 92,069,914 people shows no correlation between the proportion of Immigrants from Congo and percentage of single mother households in the United States with a correlation coefficient (R) of -0.015 and weighted average of 8.1%, a difference of 49.3%.
Single Mother Households Correlation Summary
| Measurement | Lithuanian | Immigrants from Congo |
| Minimum | 1.4% | 1.6% |
| Maximum | 20.0% | 15.4% |
| Range | 18.6% | 13.8% |
| Mean | 6.0% | 8.3% |
| Median | 5.0% | 8.2% |
| Interquartile 25% (IQ1) | 4.0% | 6.7% |
| Interquartile 75% (IQ3) | 7.5% | 9.5% |
| Interquartile Range (IQR) | 3.6% | 2.7% |
| Standard Deviation (Sample) | 3.3% | 2.7% |
| Standard Deviation (Population) | 3.3% | 2.7% |
Similar Demographics by Single Mother Households
Demographics Similar to Lithuanians by Single Mother Households
In terms of single mother households, the demographic groups most similar to Lithuanians are Immigrants from Croatia (5.4%, a difference of 0.12%), Croatian (5.5%, a difference of 0.38%), Norwegian (5.5%, a difference of 0.56%), Immigrants from South Central Asia (5.4%, a difference of 0.70%), and Macedonian (5.4%, a difference of 0.76%).
| Demographics | Rating | Rank | Single Mother Households |
| Immigrants | Belgium | 99.7 /100 | #37 | Exceptional 5.3% |
| Immigrants | Serbia | 99.6 /100 | #38 | Exceptional 5.4% |
| Immigrants | Sweden | 99.6 /100 | #39 | Exceptional 5.4% |
| Estonians | 99.6 /100 | #40 | Exceptional 5.4% |
| Immigrants | Greece | 99.5 /100 | #41 | Exceptional 5.4% |
| Macedonians | 99.5 /100 | #42 | Exceptional 5.4% |
| Immigrants | South Central Asia | 99.5 /100 | #43 | Exceptional 5.4% |
| Lithuanians | 99.4 /100 | #44 | Exceptional 5.4% |
| Immigrants | Croatia | 99.4 /100 | #45 | Exceptional 5.4% |
| Croatians | 99.3 /100 | #46 | Exceptional 5.5% |
| Norwegians | 99.3 /100 | #47 | Exceptional 5.5% |
| Turks | 99.2 /100 | #48 | Exceptional 5.5% |
| Immigrants | Latvia | 99.2 /100 | #49 | Exceptional 5.5% |
| Immigrants | Scotland | 99.2 /100 | #50 | Exceptional 5.5% |
| Immigrants | Belarus | 99.2 /100 | #51 | Exceptional 5.5% |
Demographics Similar to Immigrants from Congo by Single Mother Households
In terms of single mother households, the demographic groups most similar to Immigrants from Congo are Honduran (8.1%, a difference of 0.29%), Bangladeshi (8.1%, a difference of 0.29%), Cheyenne (8.1%, a difference of 0.35%), Immigrants from Grenada (8.2%, a difference of 0.45%), and Immigrants from Mexico (8.2%, a difference of 0.57%).
| Demographics | Rating | Rank | Single Mother Households |
| Natives/Alaskans | 0.0 /100 | #304 | Tragic 8.0% |
| Colville | 0.0 /100 | #305 | Tragic 8.0% |
| Immigrants | Barbados | 0.0 /100 | #306 | Tragic 8.0% |
| Immigrants | St. Vincent and the Grenadines | 0.0 /100 | #307 | Tragic 8.0% |
| Immigrants | Central America | 0.0 /100 | #308 | Tragic 8.1% |
| Cheyenne | 0.0 /100 | #309 | Tragic 8.1% |
| Hondurans | 0.0 /100 | #310 | Tragic 8.1% |
| Immigrants | Congo | 0.0 /100 | #311 | Tragic 8.1% |
| Bangladeshis | 0.0 /100 | #312 | Tragic 8.1% |
| Immigrants | Grenada | 0.0 /100 | #313 | Tragic 8.2% |
| Immigrants | Mexico | 0.0 /100 | #314 | Tragic 8.2% |
| Immigrants | Western Africa | 0.0 /100 | #315 | Tragic 8.2% |
| Africans | 0.0 /100 | #316 | Tragic 8.2% |
| Immigrants | Honduras | 0.0 /100 | #317 | Tragic 8.2% |
| Senegalese | 0.0 /100 | #318 | Tragic 8.2% |