Spanish American vs Delaware Child Poverty Under the Age of 16
COMPARE
Spanish American
Delaware
Child Poverty Under the Age of 16
Child Poverty Under the Age of 16 Comparison
Spanish Americans
Delaware
19.2%
CHILD POVERTY UNDER THE AGE OF 16
0.2/ 100
METRIC RATING
258th/ 347
METRIC RANK
17.0%
CHILD POVERTY UNDER THE AGE OF 16
17.1/ 100
METRIC RATING
198th/ 347
METRIC RANK
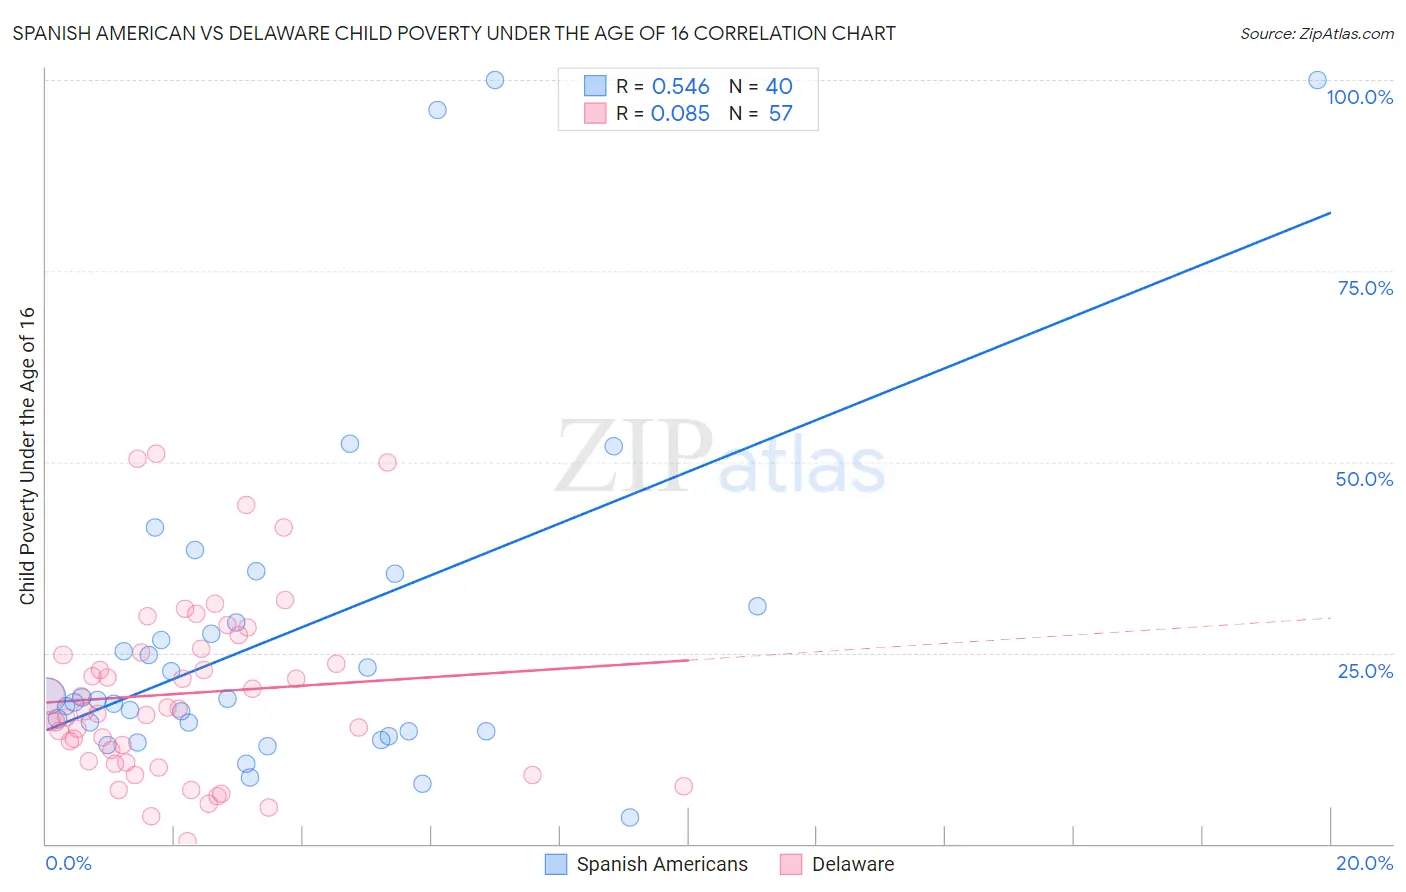
Spanish American vs Delaware Child Poverty Under the Age of 16 Correlation Chart
The statistical analysis conducted on geographies consisting of 102,994,758 people shows a substantial positive correlation between the proportion of Spanish Americans and poverty level among children under the age of 16 in the United States with a correlation coefficient (R) of 0.546 and weighted average of 19.2%. Similarly, the statistical analysis conducted on geographies consisting of 95,926,108 people shows a slight positive correlation between the proportion of Delaware and poverty level among children under the age of 16 in the United States with a correlation coefficient (R) of 0.085 and weighted average of 17.0%, a difference of 13.3%.
Child Poverty Under the Age of 16 Correlation Summary
| Measurement | Spanish American | Delaware |
| Minimum | 3.4% | 0.33% |
| Maximum | 100.0% | 51.0% |
| Range | 96.6% | 50.7% |
| Mean | 27.5% | 19.7% |
| Median | 18.9% | 17.4% |
| Interquartile 25% (IQ1) | 14.7% | 10.7% |
| Interquartile 75% (IQ3) | 30.1% | 25.3% |
| Interquartile Range (IQR) | 15.4% | 14.6% |
| Standard Deviation (Sample) | 23.2% | 11.7% |
| Standard Deviation (Population) | 22.9% | 11.6% |
Similar Demographics by Child Poverty Under the Age of 16
Demographics Similar to Spanish Americans by Child Poverty Under the Age of 16
In terms of child poverty under the age of 16, the demographic groups most similar to Spanish Americans are Ottawa (19.2%, a difference of 0.080%), Inupiat (19.2%, a difference of 0.090%), Trinidadian and Tobagonian (19.2%, a difference of 0.18%), Immigrants from Western Africa (19.2%, a difference of 0.35%), and Mexican American Indian (19.3%, a difference of 0.55%).
| Demographics | Rating | Rank | Child Poverty Under the Age of 16 |
| Immigrants | Ghana | 0.3 /100 | #251 | Tragic 19.1% |
| Immigrants | Trinidad and Tobago | 0.3 /100 | #252 | Tragic 19.1% |
| Salvadorans | 0.3 /100 | #253 | Tragic 19.1% |
| Immigrants | Western Africa | 0.2 /100 | #254 | Tragic 19.2% |
| Trinidadians and Tobagonians | 0.2 /100 | #255 | Tragic 19.2% |
| Inupiat | 0.2 /100 | #256 | Tragic 19.2% |
| Ottawa | 0.2 /100 | #257 | Tragic 19.2% |
| Spanish Americans | 0.2 /100 | #258 | Tragic 19.2% |
| Mexican American Indians | 0.2 /100 | #259 | Tragic 19.3% |
| Guyanese | 0.2 /100 | #260 | Tragic 19.3% |
| Immigrants | Burma/Myanmar | 0.1 /100 | #261 | Tragic 19.4% |
| Immigrants | Guyana | 0.1 /100 | #262 | Tragic 19.4% |
| Vietnamese | 0.1 /100 | #263 | Tragic 19.4% |
| Immigrants | Ecuador | 0.1 /100 | #264 | Tragic 19.4% |
| Chickasaw | 0.1 /100 | #265 | Tragic 19.5% |
Demographics Similar to Delaware by Child Poverty Under the Age of 16
In terms of child poverty under the age of 16, the demographic groups most similar to Delaware are Immigrants from Kenya (16.9%, a difference of 0.40%), Immigrants from Afghanistan (17.0%, a difference of 0.41%), Immigrants from Cameroon (17.1%, a difference of 0.51%), Immigrants from Uzbekistan (17.1%, a difference of 0.52%), and Ugandan (17.1%, a difference of 0.60%).
| Demographics | Rating | Rank | Child Poverty Under the Age of 16 |
| Immigrants | Iraq | 28.3 /100 | #191 | Fair 16.7% |
| Spanish | 24.5 /100 | #192 | Fair 16.7% |
| Spaniards | 23.2 /100 | #193 | Fair 16.8% |
| Immigrants | Uruguay | 23.1 /100 | #194 | Fair 16.8% |
| Immigrants | Uganda | 22.5 /100 | #195 | Fair 16.8% |
| Immigrants | Lebanon | 22.0 /100 | #196 | Fair 16.8% |
| Immigrants | Kenya | 19.1 /100 | #197 | Poor 16.9% |
| Delaware | 17.1 /100 | #198 | Poor 17.0% |
| Immigrants | Afghanistan | 15.1 /100 | #199 | Poor 17.0% |
| Immigrants | Cameroon | 14.7 /100 | #200 | Poor 17.1% |
| Immigrants | Uzbekistan | 14.7 /100 | #201 | Poor 17.1% |
| Ugandans | 14.3 /100 | #202 | Poor 17.1% |
| Immigrants | Sierra Leone | 14.2 /100 | #203 | Poor 17.1% |
| Hmong | 14.0 /100 | #204 | Poor 17.1% |
| Aleuts | 13.9 /100 | #205 | Poor 17.1% |