Immigrants from Afghanistan vs Delaware Child Poverty Under the Age of 16
COMPARE
Immigrants from Afghanistan
Delaware
Child Poverty Under the Age of 16
Child Poverty Under the Age of 16 Comparison
Immigrants from Afghanistan
Delaware
17.0%
CHILD POVERTY UNDER THE AGE OF 16
15.1/ 100
METRIC RATING
199th/ 347
METRIC RANK
17.0%
CHILD POVERTY UNDER THE AGE OF 16
17.1/ 100
METRIC RATING
198th/ 347
METRIC RANK
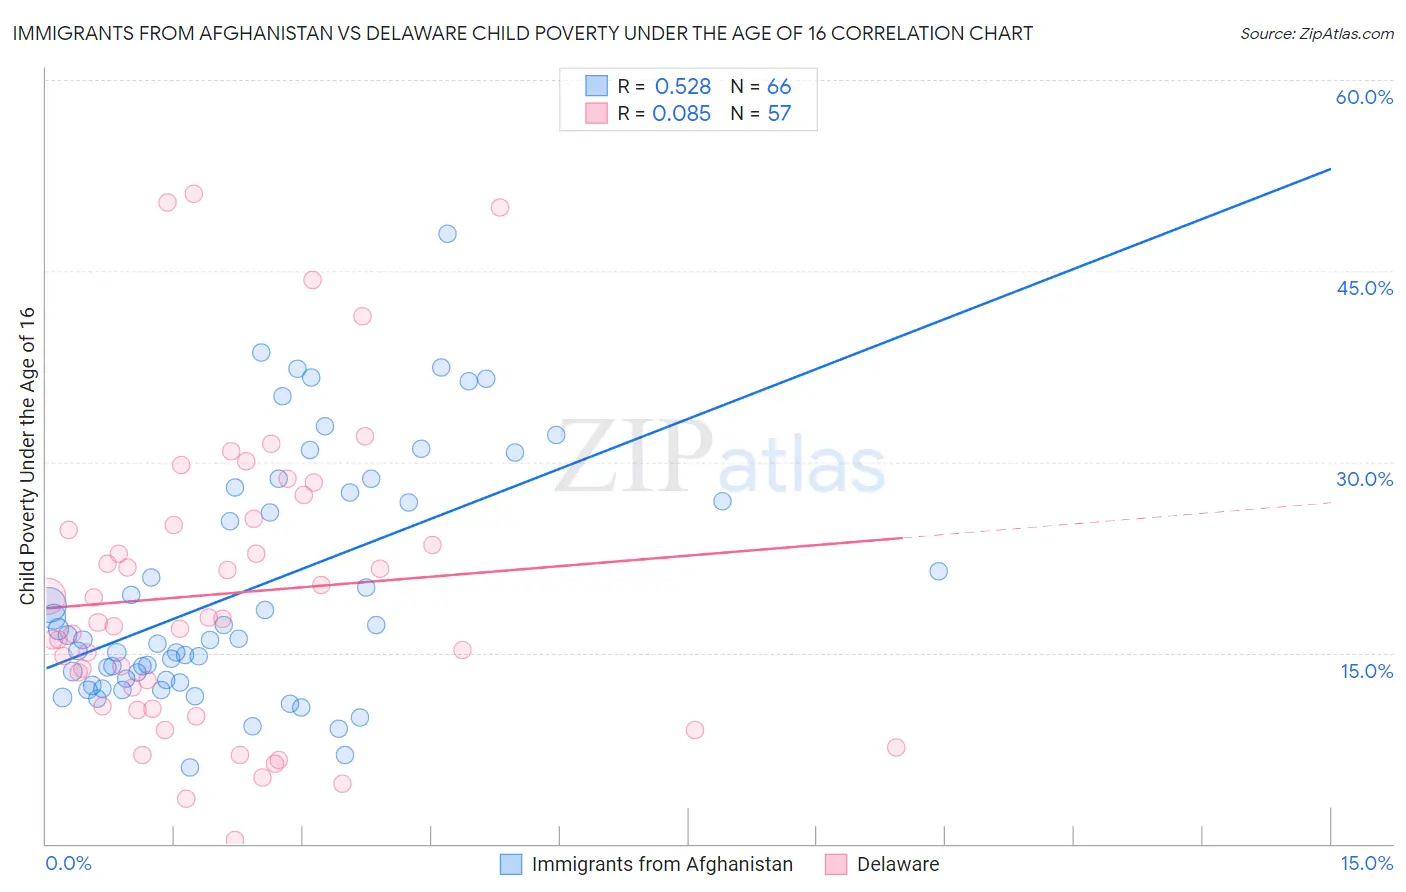
Immigrants from Afghanistan vs Delaware Child Poverty Under the Age of 16 Correlation Chart
The statistical analysis conducted on geographies consisting of 147,262,945 people shows a substantial positive correlation between the proportion of Immigrants from Afghanistan and poverty level among children under the age of 16 in the United States with a correlation coefficient (R) of 0.528 and weighted average of 17.0%. Similarly, the statistical analysis conducted on geographies consisting of 95,926,108 people shows a slight positive correlation between the proportion of Delaware and poverty level among children under the age of 16 in the United States with a correlation coefficient (R) of 0.085 and weighted average of 17.0%, a difference of 0.41%.
Child Poverty Under the Age of 16 Correlation Summary
| Measurement | Immigrants from Afghanistan | Delaware |
| Minimum | 6.0% | 0.33% |
| Maximum | 48.0% | 51.0% |
| Range | 42.0% | 50.7% |
| Mean | 20.0% | 19.7% |
| Median | 16.0% | 17.4% |
| Interquartile 25% (IQ1) | 12.9% | 10.7% |
| Interquartile 75% (IQ3) | 27.6% | 25.3% |
| Interquartile Range (IQR) | 14.7% | 14.6% |
| Standard Deviation (Sample) | 9.6% | 11.7% |
| Standard Deviation (Population) | 9.5% | 11.6% |
Demographics Similar to Immigrants from Afghanistan and Delaware by Child Poverty Under the Age of 16
In terms of child poverty under the age of 16, the demographic groups most similar to Immigrants from Afghanistan are Immigrants from Cameroon (17.1%, a difference of 0.10%), Immigrants from Uzbekistan (17.1%, a difference of 0.11%), Ugandan (17.1%, a difference of 0.19%), Immigrants from Sierra Leone (17.1%, a difference of 0.21%), and Hmong (17.1%, a difference of 0.27%). Similarly, the demographic groups most similar to Delaware are Immigrants from Kenya (16.9%, a difference of 0.40%), Immigrants from Cameroon (17.1%, a difference of 0.51%), Immigrants from Uzbekistan (17.1%, a difference of 0.52%), Ugandan (17.1%, a difference of 0.60%), and Immigrants from Sierra Leone (17.1%, a difference of 0.61%).
| Demographics | Rating | Rank | Child Poverty Under the Age of 16 |
| Immigrants | Morocco | 31.2 /100 | #188 | Fair 16.6% |
| Immigrants | Portugal | 30.0 /100 | #189 | Fair 16.6% |
| Immigrants | Costa Rica | 29.6 /100 | #190 | Fair 16.6% |
| Immigrants | Iraq | 28.3 /100 | #191 | Fair 16.7% |
| Spanish | 24.5 /100 | #192 | Fair 16.7% |
| Spaniards | 23.2 /100 | #193 | Fair 16.8% |
| Immigrants | Uruguay | 23.1 /100 | #194 | Fair 16.8% |
| Immigrants | Uganda | 22.5 /100 | #195 | Fair 16.8% |
| Immigrants | Lebanon | 22.0 /100 | #196 | Fair 16.8% |
| Immigrants | Kenya | 19.1 /100 | #197 | Poor 16.9% |
| Delaware | 17.1 /100 | #198 | Poor 17.0% |
| Immigrants | Afghanistan | 15.1 /100 | #199 | Poor 17.0% |
| Immigrants | Cameroon | 14.7 /100 | #200 | Poor 17.1% |
| Immigrants | Uzbekistan | 14.7 /100 | #201 | Poor 17.1% |
| Ugandans | 14.3 /100 | #202 | Poor 17.1% |
| Immigrants | Sierra Leone | 14.2 /100 | #203 | Poor 17.1% |
| Hmong | 14.0 /100 | #204 | Poor 17.1% |
| Aleuts | 13.9 /100 | #205 | Poor 17.1% |
| Alaska Natives | 11.8 /100 | #206 | Poor 17.2% |
| German Russians | 8.6 /100 | #207 | Tragic 17.4% |
| Pennsylvania Germans | 7.5 /100 | #208 | Tragic 17.4% |